

Question: Is there a relationship between the protein content and the cost of deli sandwiches? Use software to analyze the data in the table below,
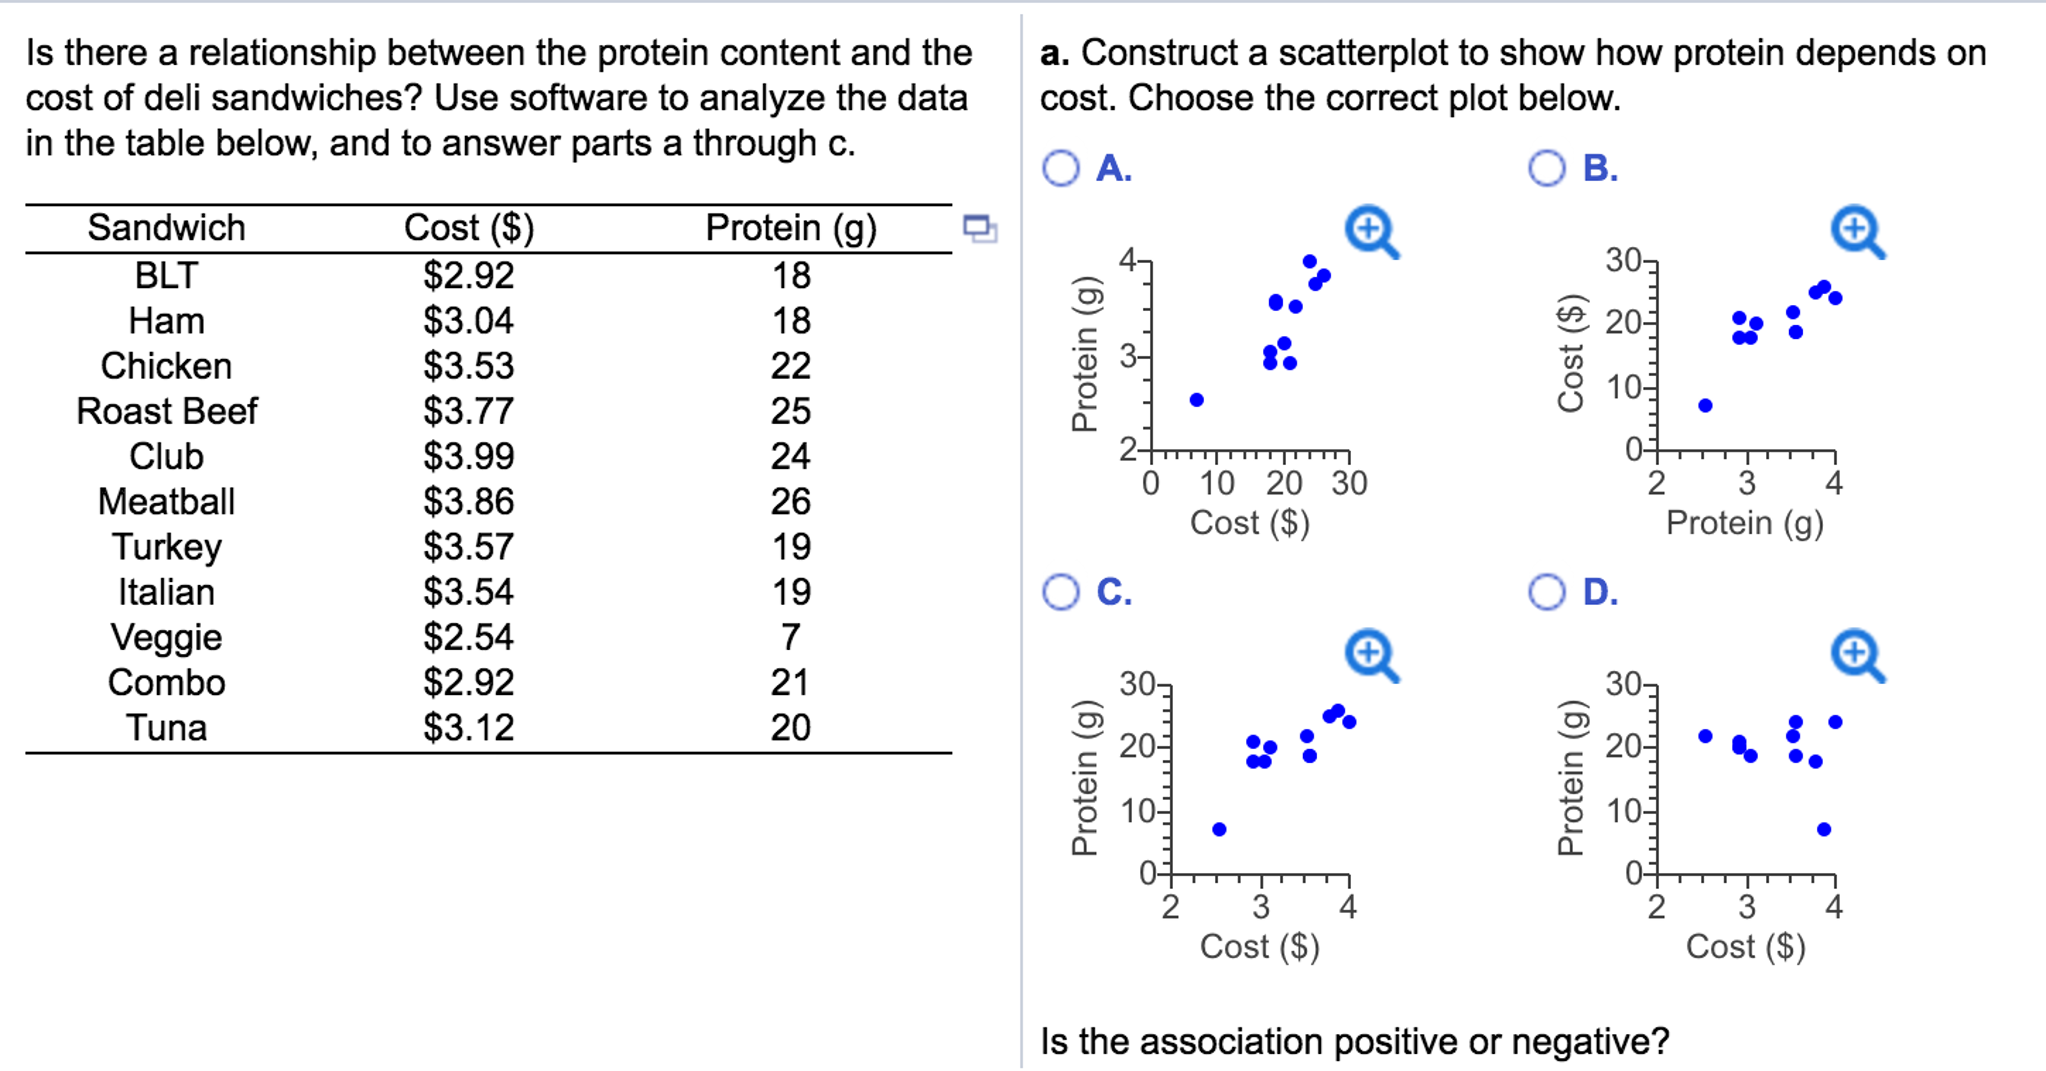
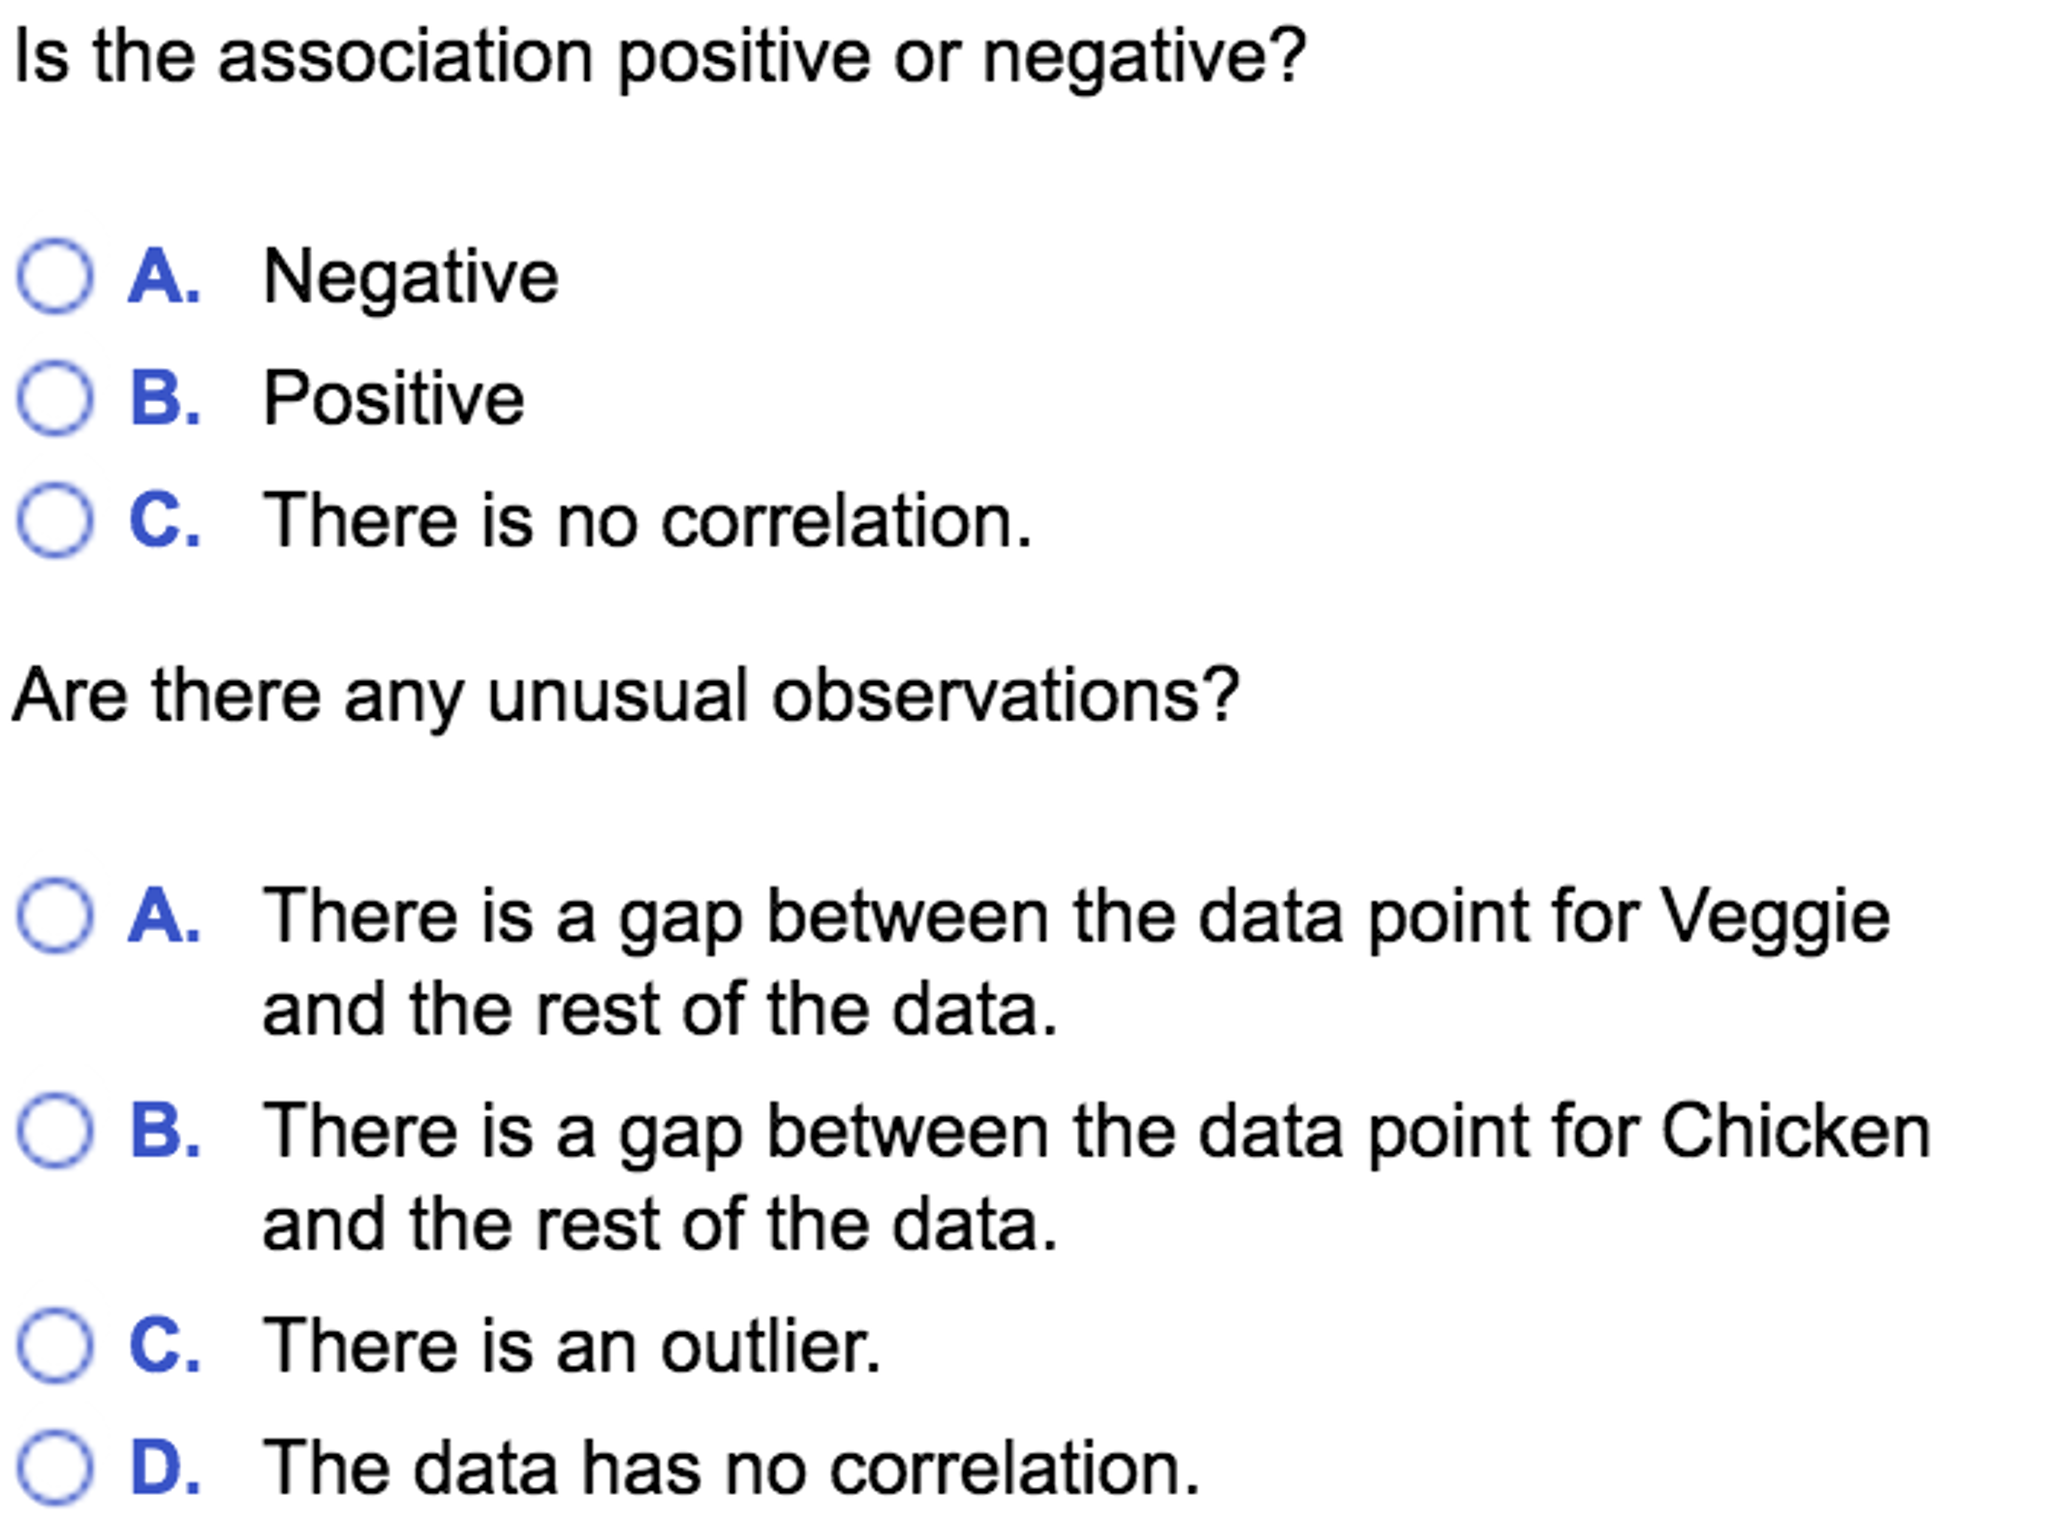
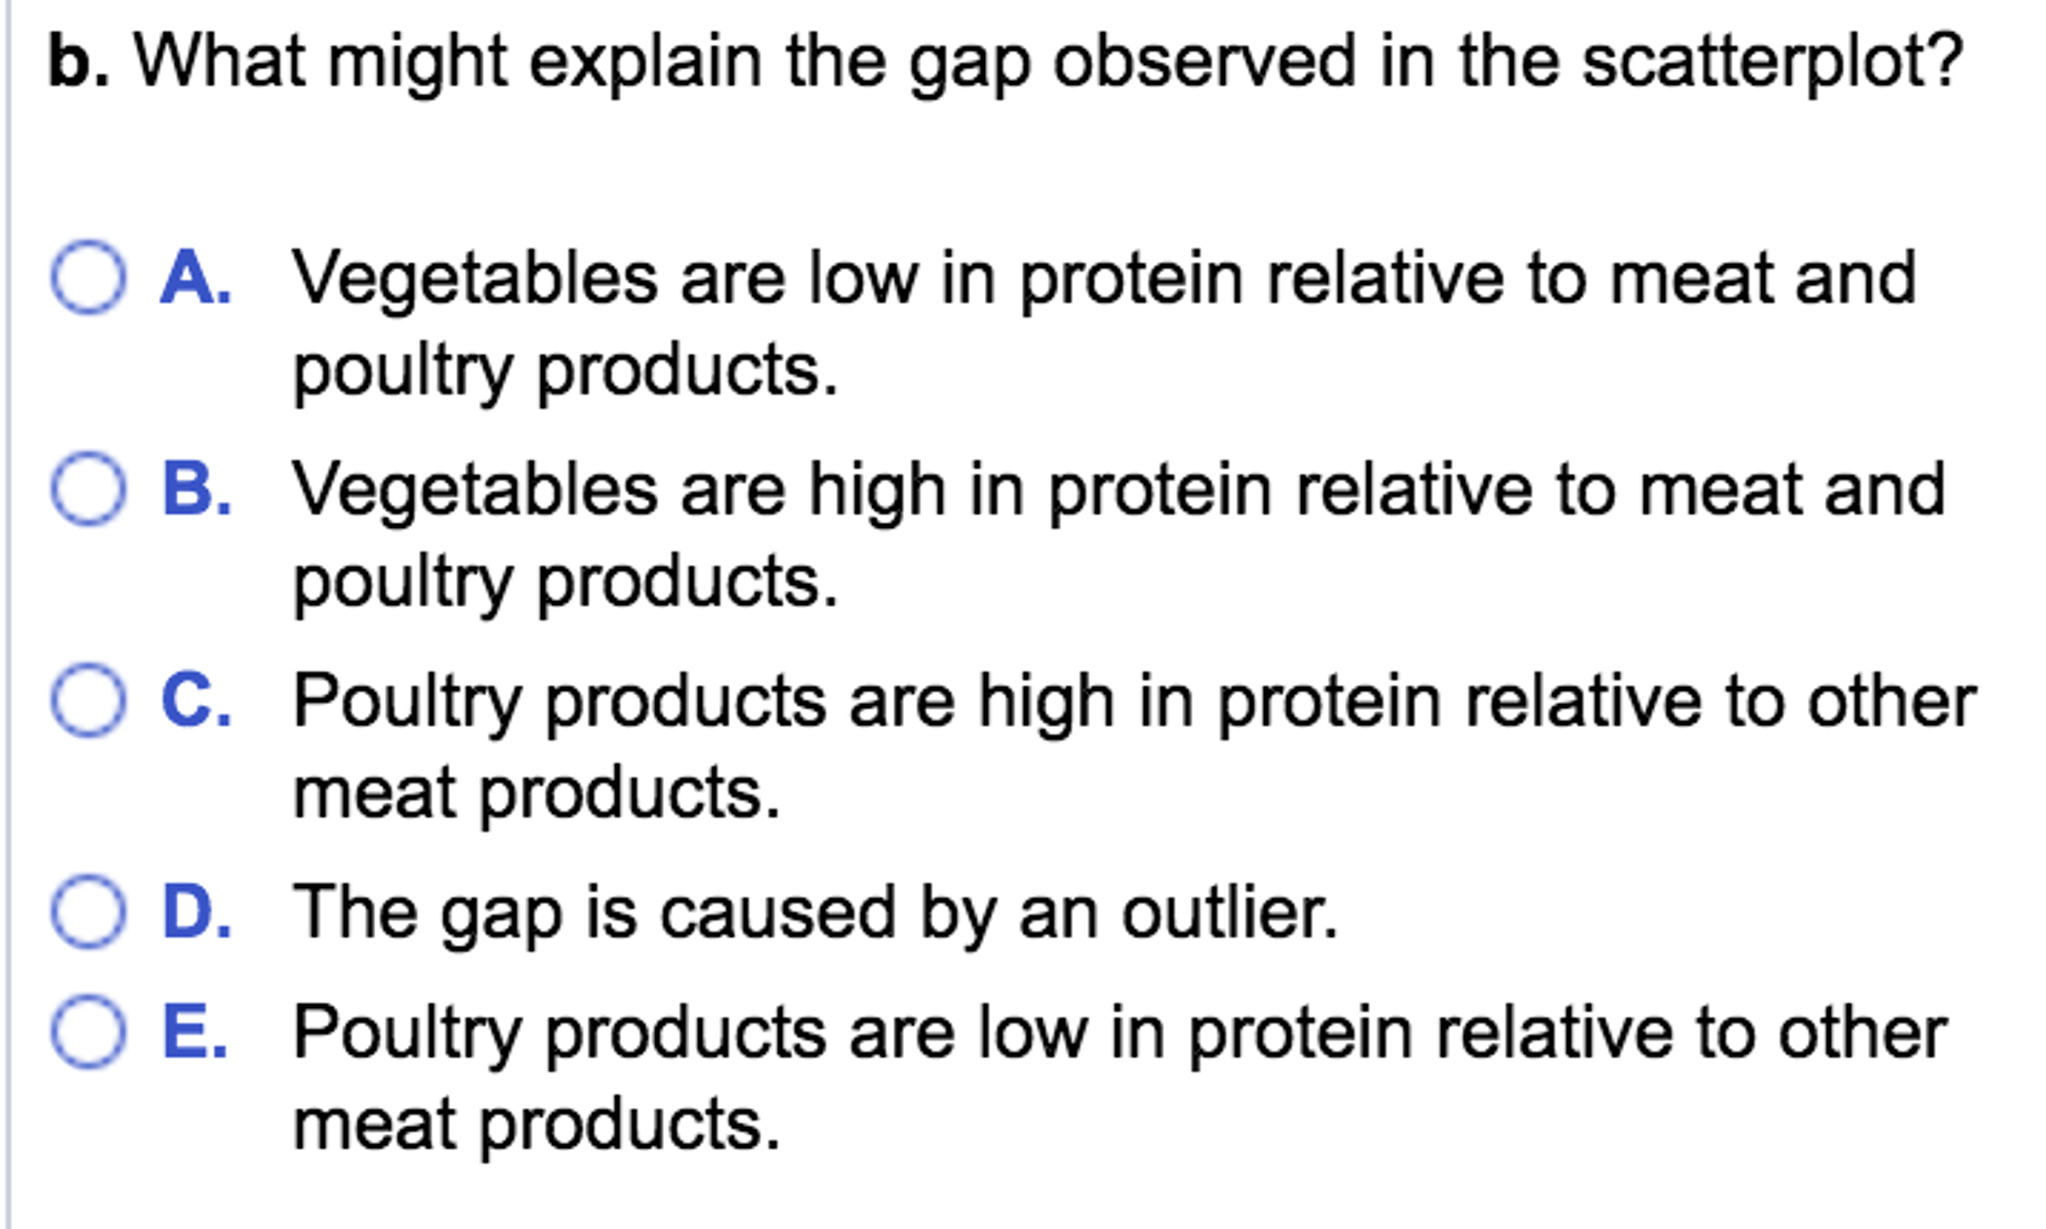
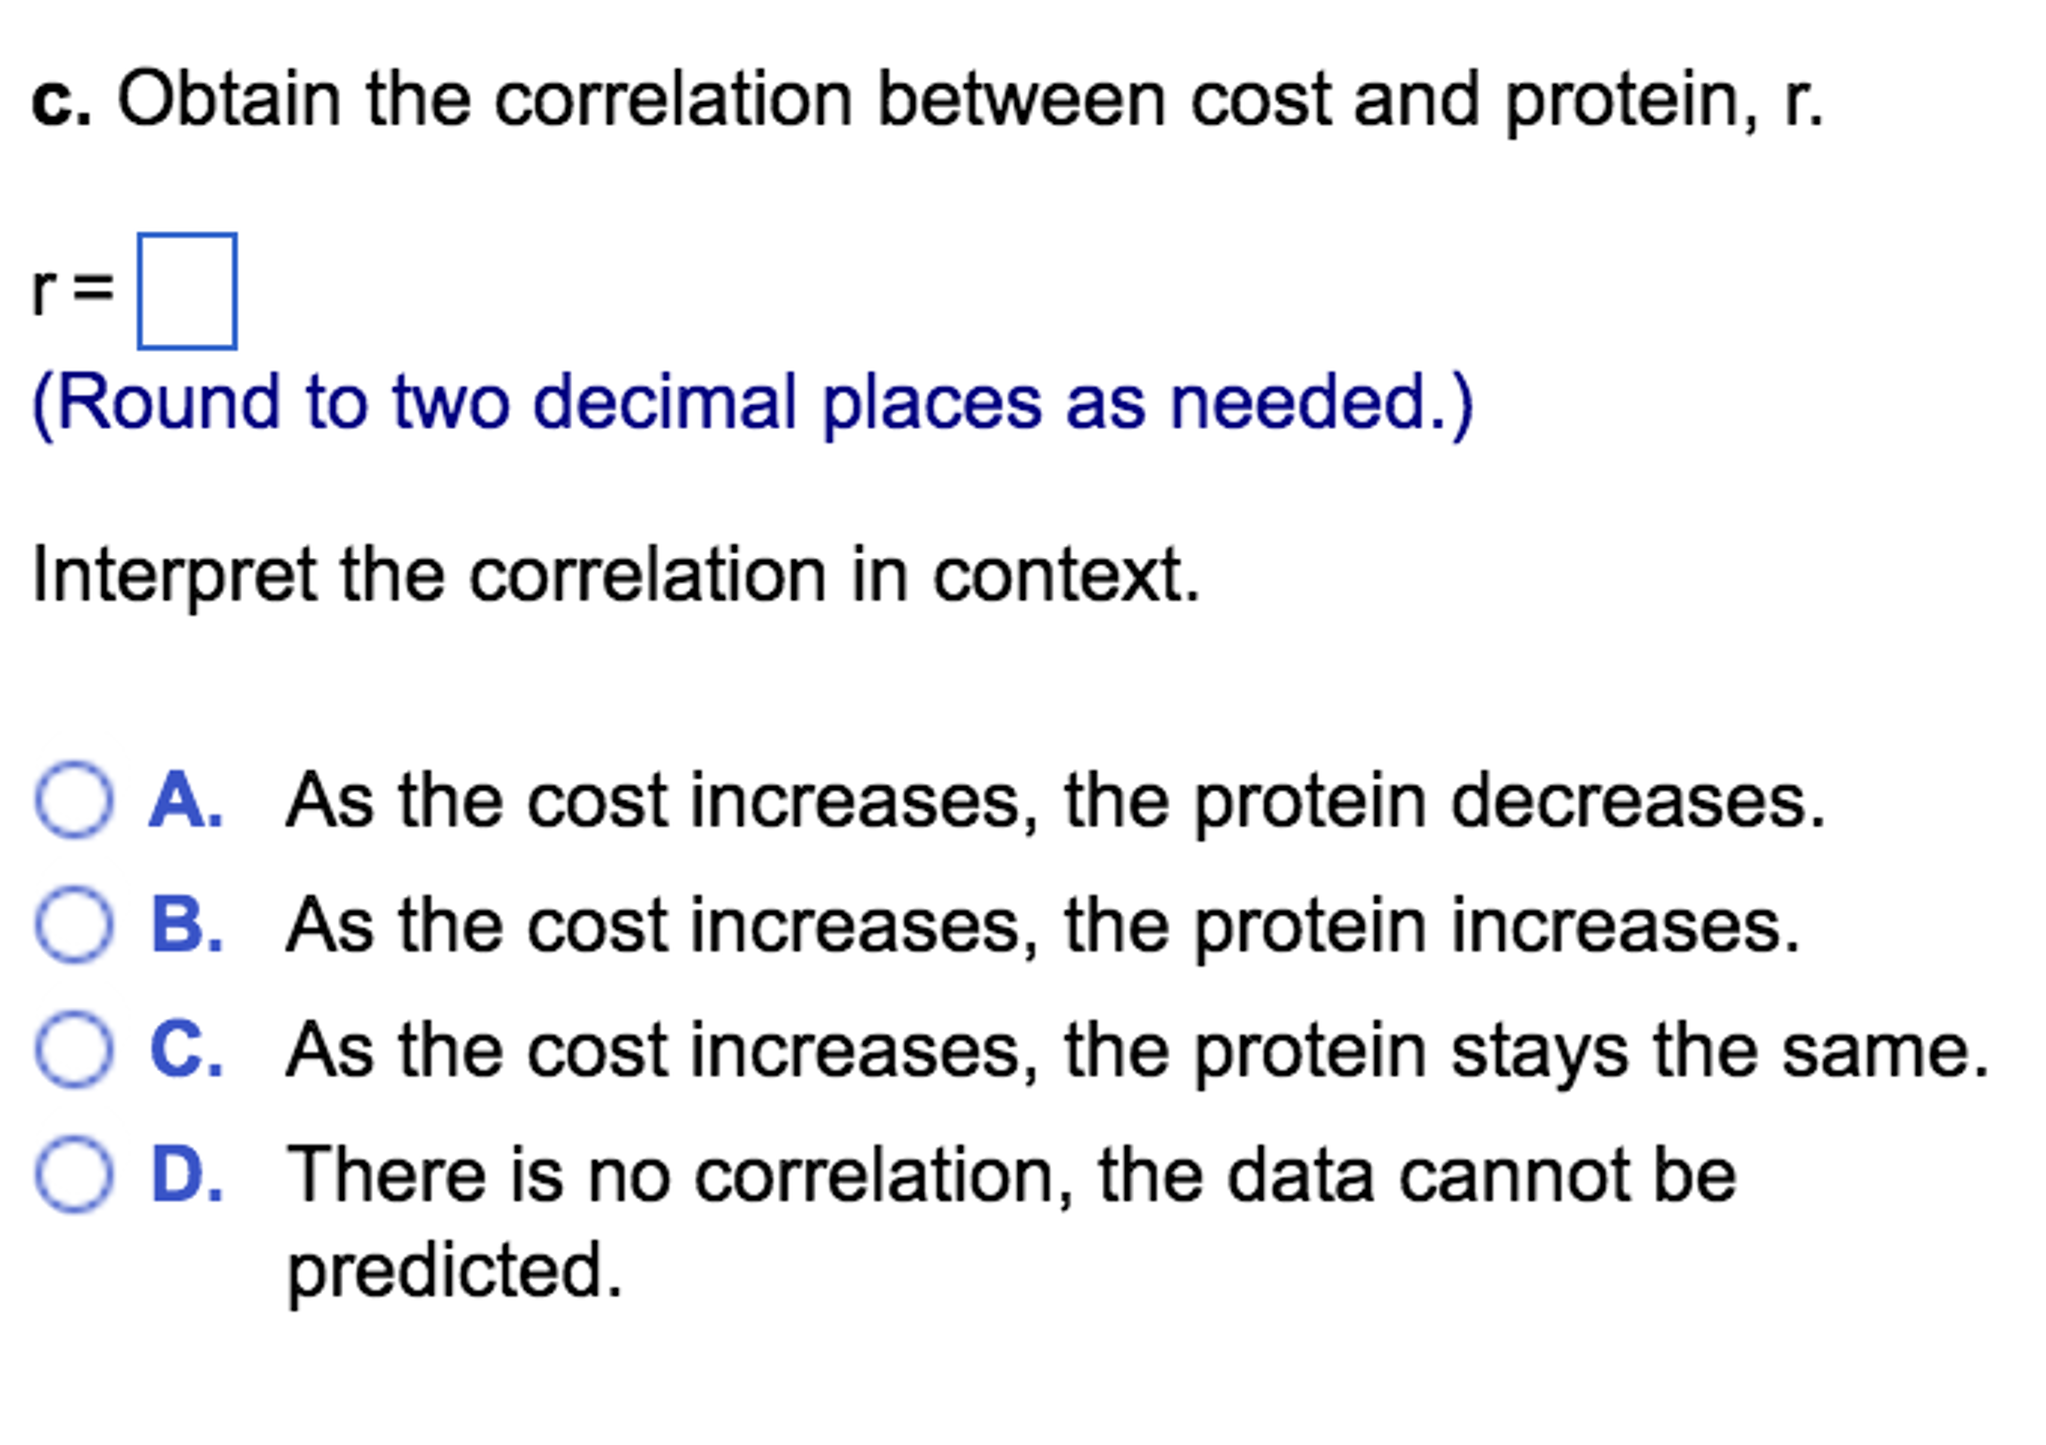
Is there a relationship between the protein content and the cost of deli sandwiches? Use software to analyze the data in the table below, and to answer parts a through c. Sandwich BLT Ham Chicken Roast Beef Club Meatball Turkey Italian Veggie Combo Tuna Cost ($) $2.92 $3.04 $3.53 $3.77 $3.99 $3.86 $3.57 $3.54 $2.54 $2.92 $3.12 Protein (g) 18 18 22 25 24 26 19 19 7 21 20 a. Construct a scatterplot to show how protein depends on cost. Choose the correct plot below. O A. B. Protein (g) C. Protein (g) 0 10 20 30 Cost ($) 20- to 2 3 4 Cost ($) Cost ($) 30- 20-3 Protein (g) 103 O D. 0+ 4 2 3 Protein (g) 20- 0+ 2 Is the association positive or negative? 3 4 Cost ($) Is the association positive or negative? OA. Negative O B. Positive OC. There is no correlation. Are there any unusual observations? O A. There is a gap between the data point for Veggie and the rest of the data. O B. O C. O D. There is a gap between the data point for Chicken and the rest of the data. There is an outlier. The data has no correlation. b. What might explain the gap observed in the scatterplot? O A. Vegetables are low in protein relative to meat and poultry products. O B. C. Poultry products are high in protein relative to other meat products. OD. The gap is caused by an outlier. E. O Vegetables are high in protein relative to meat and poultry products. Poultry products are low in protein relative to other meat products. c. Obtain the correlation between cost and protein, r. (Round to two decimal places as needed.) Interpret the correlation in context. O A. As the cost increases, the protein decreases. B. As the cost increases, the protein increases. C. As the cost increases, the protein stays the same. There is no correlation, the data cannot be O D. predicted.
Step by Step Solution
3.42 Rating (155 Votes )
There are 3 Steps involved in it

Get step-by-step solutions from verified subject matter experts