

Question: Is there any problem with MAXMILLIAN CORPORATION based on the exhibition below? -7- Exhibit 1 MAXMILLIAN CORPORATION Comparative Financial Data, 1978 American National Publicker Hiram
Is there any problem with MAXMILLIAN CORPORATION based on the exhibition below?
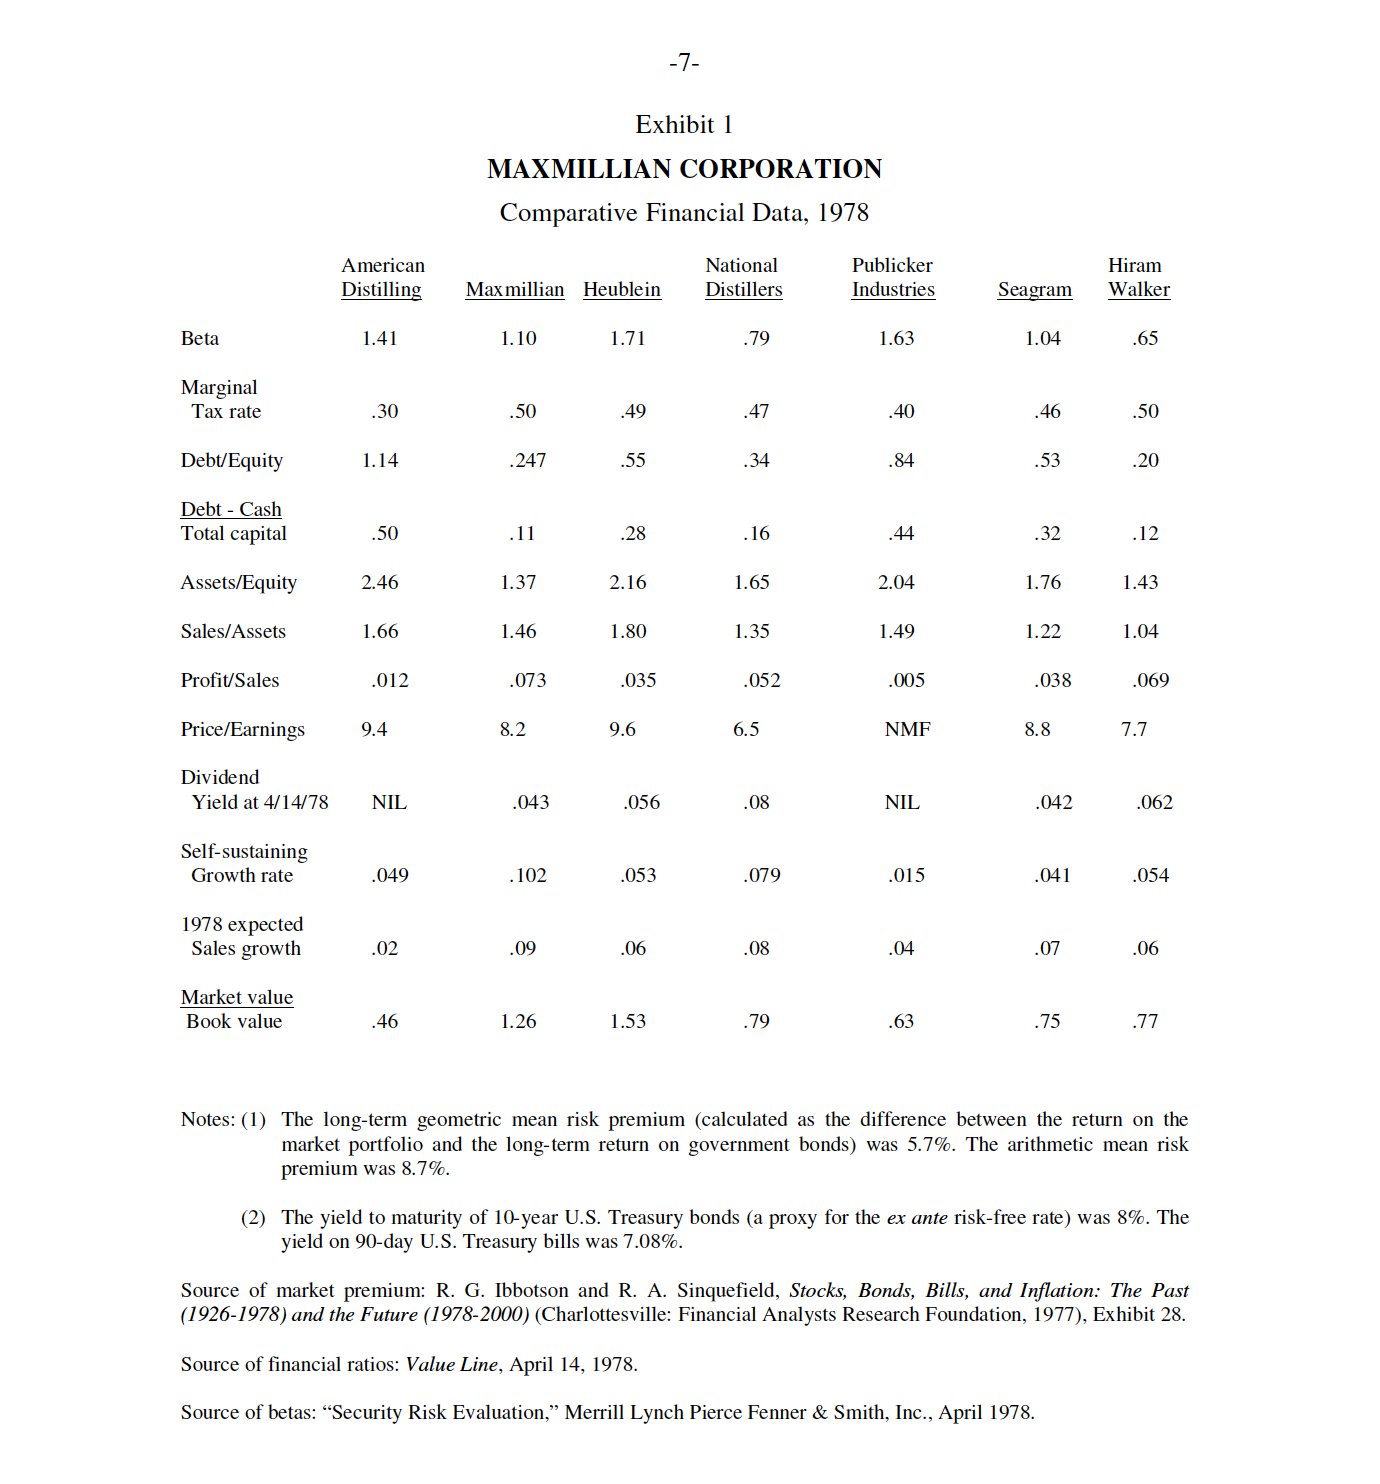
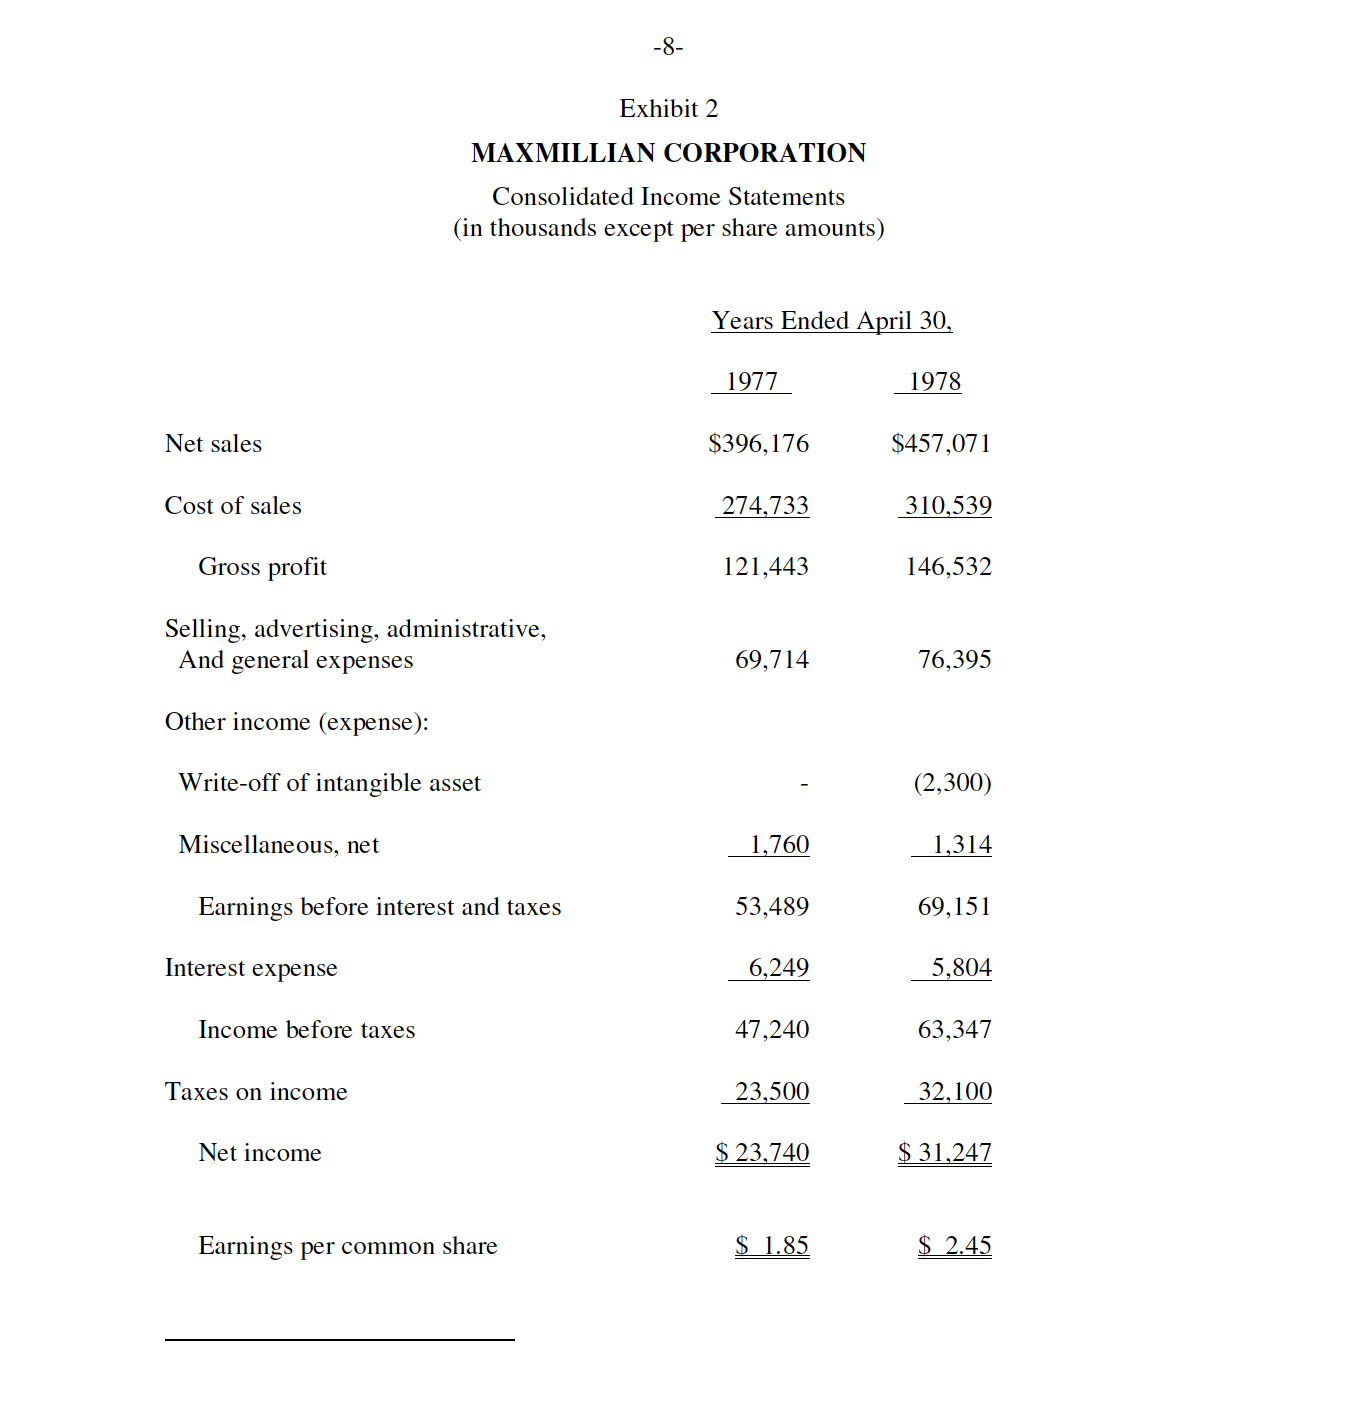
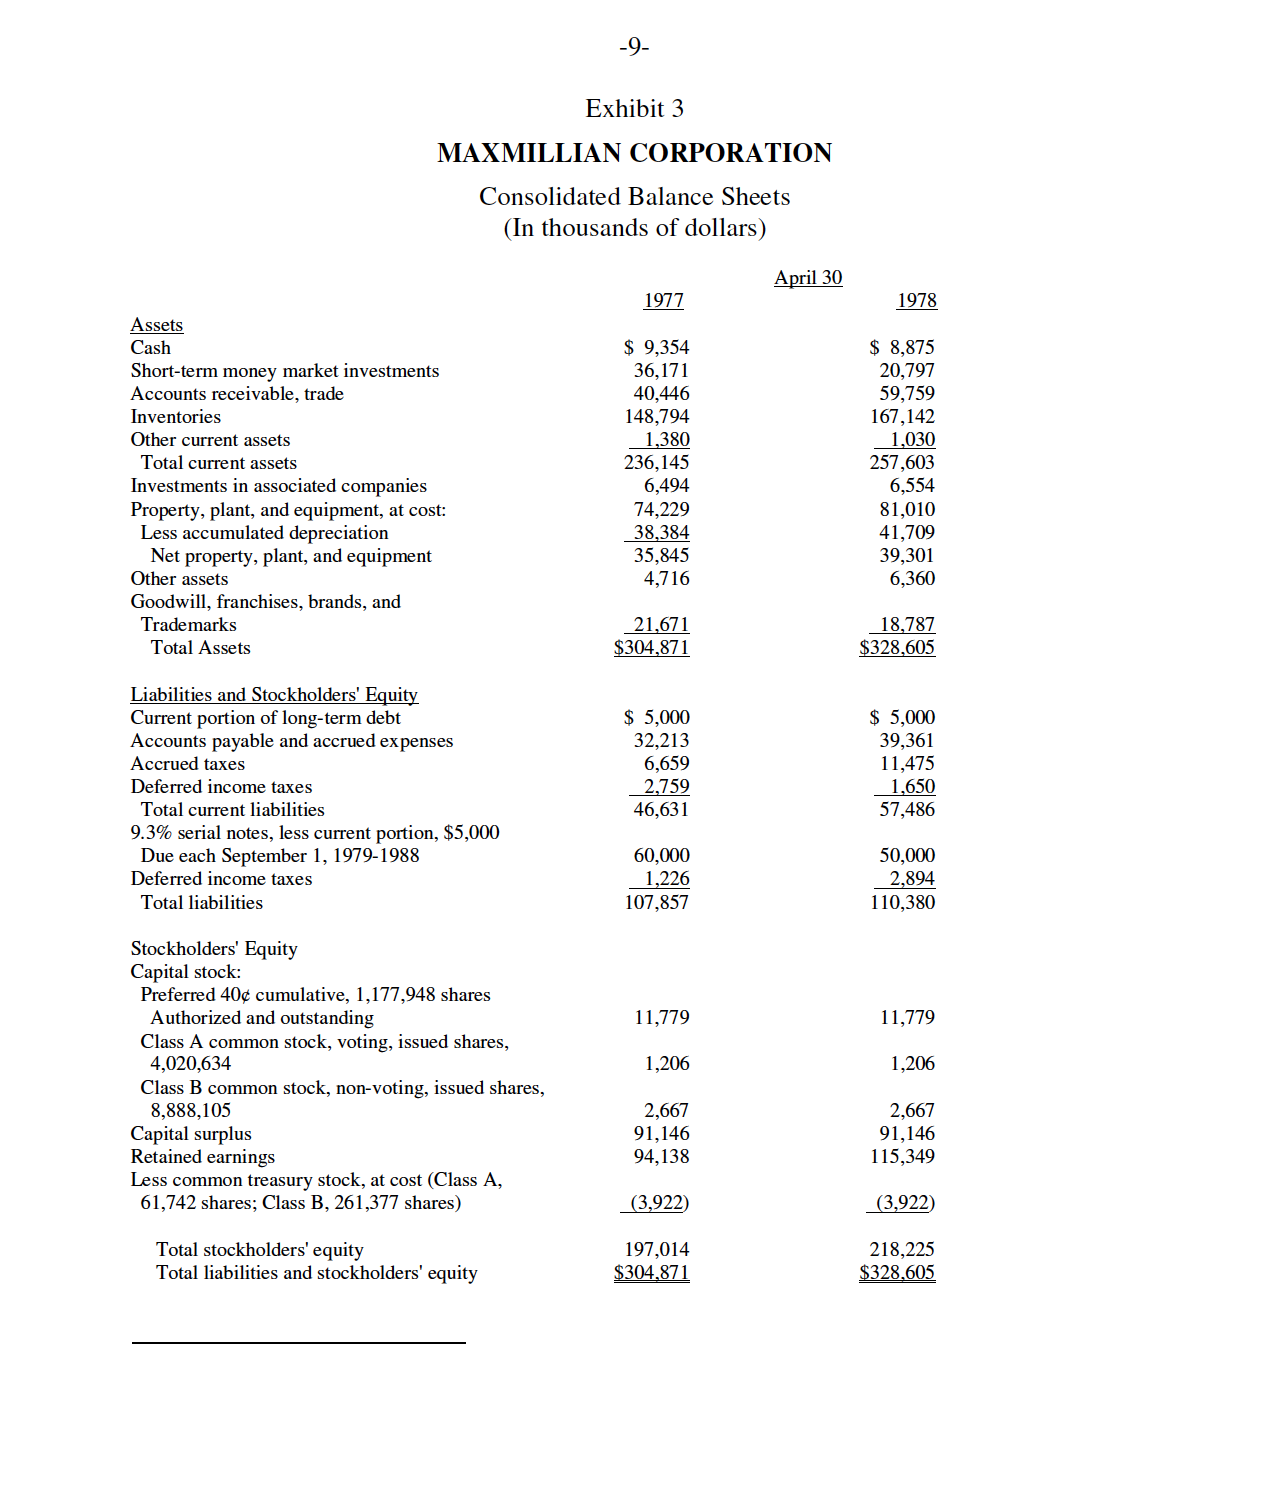
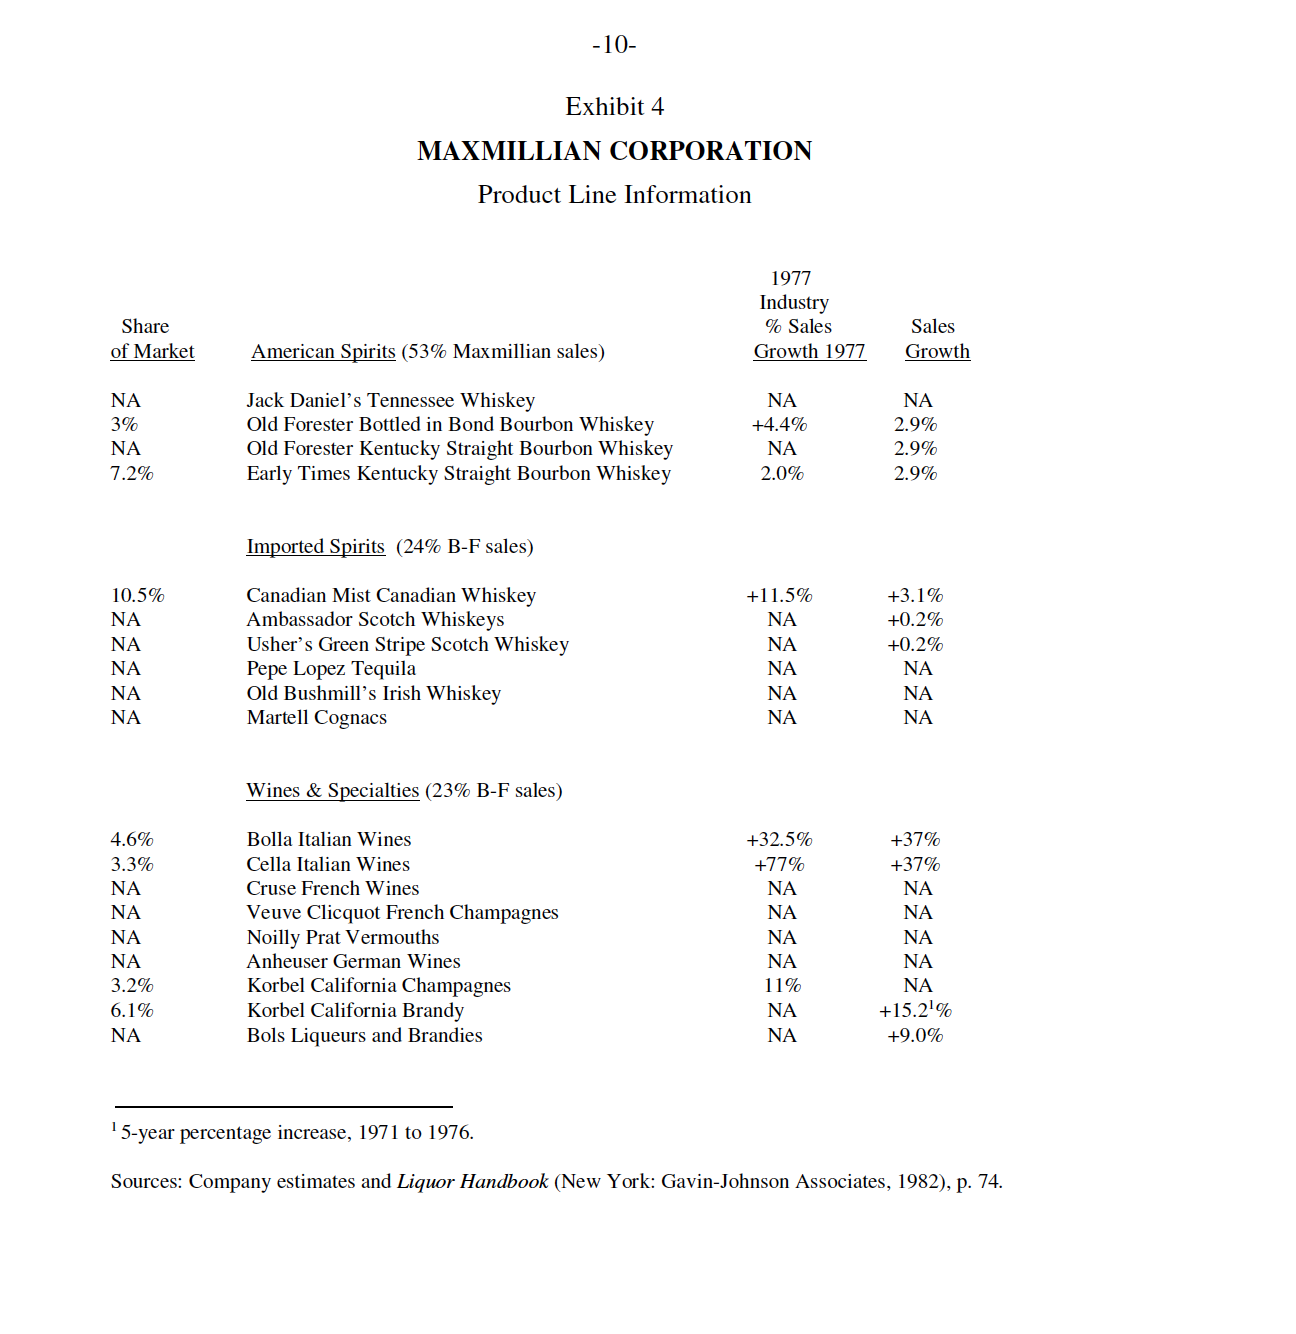
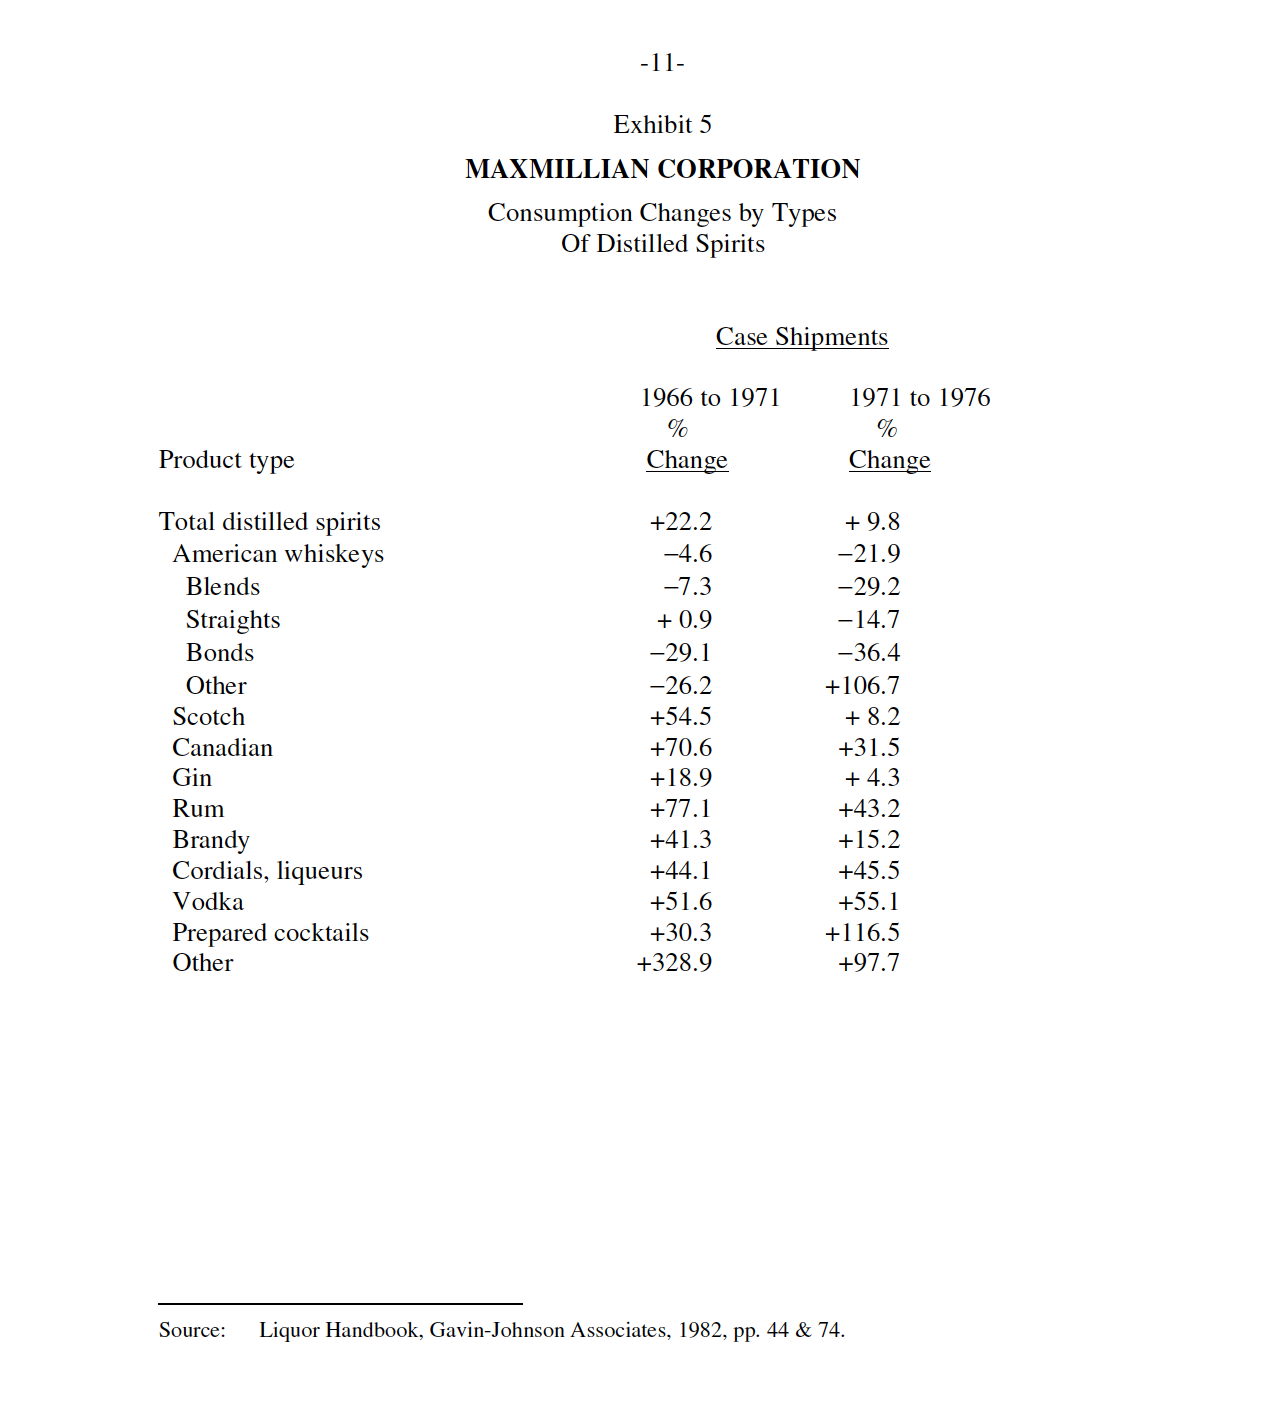
-7- Exhibit 1 MAXMILLIAN CORPORATION Comparative Financial Data, 1978 American National Publicker Hiram Distilling Max millian Heublein Distillers Industries Seagram Walker Beta 1.41 1. 10 1.71 79 1.63 1.04 .65 Marginal Tax rate .30 50 49 47 40 46 .50 Debt/Equity 1.14 .247 55 34 84 53 .20 Debt - Cash Total capital .50 .11 .28 . 16 .44 .32 . 12 Assets/Equity 2.46 1.37 2.16 1.65 2.04 1.76 1.43 Sales/Assets 1.66 1.46 1.80 1.35 1.49 1.22 1.04 Profit/Sales .012 .073 .035 .052 .005 038 .069 Price/Earnings 94 8.2 96 6.5 NMF 8.8 7.7 Dividend Yield at 4/14/78 NIL 043 .056 08 NIL 042 .062 Self-sustaining Growth rate .049 . 102 .053 079 .015 .041 .054 1978 expected Sales growth 02 09 .06 08 04 07 .06 Market value Book value ,46 1.26 1.53 79 .63 75 .77 Notes: (1) The long-term geometric mean risk premium (calculated as the difference between the return on the market portfolio and the long-term return on government bonds) was 5.7%. The arithmetic mean risk premium was 8.7%. (2) The yield to maturity of 10-year U.S. Treasury bonds (a proxy for the ex ante risk-free rate) was 8%. The yield on 90-day U.S. Treasury bills was 7.08%. Source of market premium: R. G. Ibbotson and R. A. Sinquefield, Stocks, Bonds, Bills, and Inflation: The Past (1926-1978) and the Future (1978-2000) (Charlottesville: Financial Analysts Research Foundation, 1977), Exhibit 28. Source of financial ratios: Value Line, April 14, 1978. Source of betas: "Security Risk Evaluation," Merrill Lynch Pierce Fenner & Smith, Inc., April 1978.-3- Exhibit 2 MAXMILLIAN CORPORATION Consolidated Income Statements (in thousands except per share amounts) Years Ended April 30, 1977 w Net sales $396,176 $457,071 Cost of sales 274,733 310,539 Gross prot 121,443 146,532 Selling, advertising, administrative, And general expenses 69,714 76,395 Other income (expense): Write-off of intangible asset - (2,300) Miscellaneous, net m H Earnings before interest and taxes 53,489 69,151 Interest expense M 45% Income before taxes 47,240 63,347 Taxes on income M M Net income $ 23,740 $ 31,247 Earnings per common share 1.85 SA -9- Exhibit 3 MAXMILLIAN CORPORATION Consolidated Balance Sheets (In thousands of dollars) A ' 30 m Assets Cash 215 9,354 Short-term money market investments 36,171 Accounts receivable, trade 40,446 Inventories 148,794 Other current assets 1,380 Total current assets 236,145 Investments in associated companies 6,494 Property, plant, and equipment, at cost: 74,229 Less accumulated depreciation 38,384 Net property, plant, and equipment 35,845 Other assets 4,716 Goodwill, franchises, brands, and Trademarks 21,671 Total Assets 304 871 Liabilities and Stockholders' Equity Current portion of long-term debt 3; 5,000 Accounts payable and accrued expenses 32,213 Accrued taxes 6,659 Deferred income taxes 2,759 Total current liabilities 46,631 9.3% serial notes, less current portion, $5,000 Due each September 1, 1979-1988 60,000 Deferred income taxes 1,226 Total liabilities 107,857 Stockholders' Equity Capital stock; Preferred 40 cumulative, 1,177,948 shares Authorized and outstanding 11,779 Class A common stock, voting, issued shares, 4,020,634 1 ,206 Class B common stock, non-voting, issued shares, 8,888,105 2,667 Capital surplus 91,146 Retained earnings 94,13 8 less common treasury stock, at cost (Class A, 61,742 shares; Class B, 261,377 shares) 13,922! Total stockholders' equity 197,014 Total liabilities and stockholders' equity 304 87] E $ 8,875 20,797 59,759 167,142 1 030 257,603 6,554 81,010 41,709 39,301 6,360 1 1,779 1206 2 2,667 91,146 115,349 13,922! 213,225 $328 605 -10- Exhibit 4 MAXMILLIAN CORPORATION Product Line Information 1977 Industry Share Sales Sales of Market American Spirits (53% Maxmillian sales) Growth 1977 Growth NA Jack Daniel's Tennessee Whiskey NA NA 3% Old Forester Bottled in Bond Bourbon Whiskey 14.4% 2.9% NA Old Forester Kentucky Straight Bourbon Whiskey NA 2.9% 7.2% Early Times Kentucky Straight Bourbon Whiskey 2.0% 2.9% Imported Spirits (24% B-F sales) 10.5% Canadian Mist Canadian Whiskey +11.5% +3.1% NA Ambassador Scotch Whiskeys NA +0.2% NA Usher's Green Stripe Scotch Whiskey NA +0.2% NA Pepe Lopez Tequila NA NA NA Old Bushmill's Irish Whiskey NA NA NA Martell Cognacs NA NA Wines & Specialties (23% B-F sales) 4.6% Bolla Italian Wines +32.5% +37% 3.3% Cella Italian Wines +77% +37% NA Cruse French Wines NA NA NA Veuve Clicquot French Champagnes NA NA NA Noilly Prat Vermouths NA NA NA Anheuser German Wines NA NA 3.2% Korbel California Champagnes 11% NA 6.1% Korbel California Brandy NA +15.21% NA Bols Liqueurs and Brandies NA +9.0% 5-year percentage increase, 1971 to 1976. Sources: Company estimates and Liquor Handbook (New York: Gavin-Johnson Associates, 1982), p. 74.-1]- Exhibit 5 MAXMILLIAN CORPORATION Consumption Changes by Types Of Distilled Spirits Case Shipments 1966 to 1971 1971 to 1976 % o Product type Change Change Total distilled spirits +22.2 + 9.8 American whiskeys -4.6 -21.9 Blends -7.3 -29.2 Straights + 0.9 -14.7 Bonds -29.1 -36.4 Other -26.2 +106.7 Scotch +54.5 + 8.2 Canadian +70.6 +31.5 Gin +18.9 + 4.3 Rum +77.1 +43.2 Brandy +41.3 +15.2 Cordials, liqueurs +44.1 +45.5 Vodka +51.6 +55.1 Prepared cocktails +30.3 +1 16.5 Other +328.9 +97.7 Source: Liquor Handbook, Gavin-Johnson Associates, 1982, pp. 44 & 74
Step by Step Solution
There are 3 Steps involved in it

Get step-by-step solutions from verified subject matter experts