

Question: Is this an attribute or a variable chart? ( A or V for your answer) What is the average weight of the butter containers? (Two
Is this an attribute or a variable chart? ( A or V for your answer) What is the average weight of the butter containers? (Two decimals) What is the upper control limit on the range for weight of the butter containers? (two decimals) What is the sub-group size? (no decimals) What is the total number of containers of butter that have been measured? (no decimals) What is the upper limit for the weight of the butter contrainers as specified by the customer? (two decimals) What is the Cpk for this butter container operation at this time? (two decimals) Is this process capable of producting quality product? (yes or no)
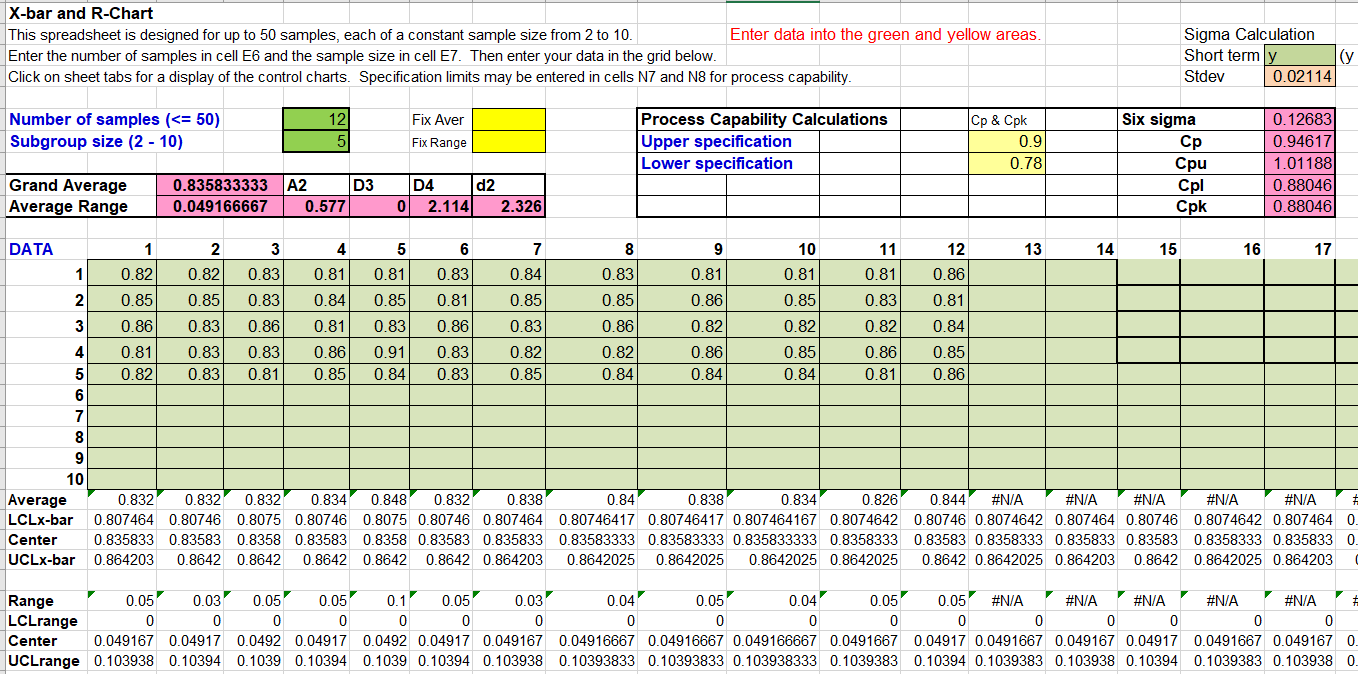 X-bar and R-Chart This spreadsheet is designed for up to 50 samples, each of a constant sample size from 2 to 10. Enter data into the green and yellow areas. Sigma Calculation Enter the number of samples in cell E6 and the sample size in cell E7. Then enter your data in the grid below. Short term y (y Click on sheet tabs for a display of the control charts. Specification limits may be entered in cells N7 and N8 for process capability. Stdev 0.02114 Number of samples (
Step by Step Solution
There are 3 Steps involved in it
1 Expert Approved Answer
Step: 1 Unlock

Question Has Been Solved by an Expert!
Get step-by-step solutions from verified subject matter experts
Step: 2 Unlock
Step: 3 Unlock