

Question: is this correct ? A quality inspector took five samples, each with six observations, of the length of time (in minutes) for glue to dry.
is this correct ? 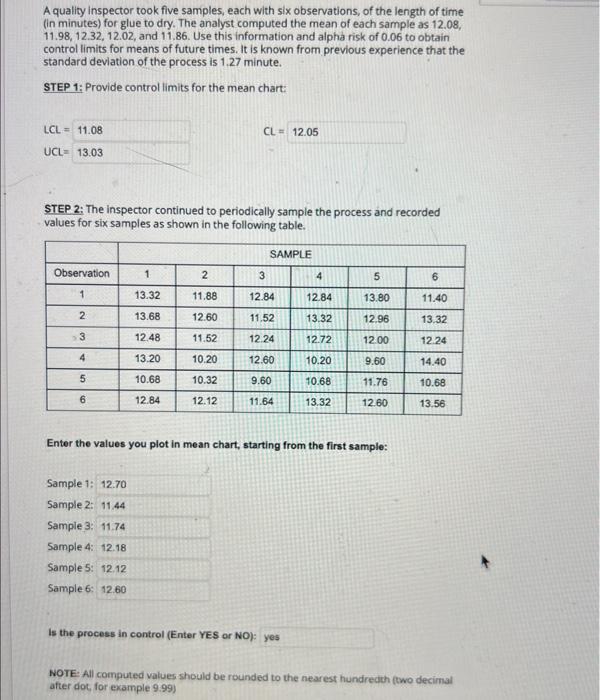
A quality inspector took five samples, each with six observations, of the length of time (in minutes) for glue to dry. The analyst computed the mean of each sample as 12.08, 11.98,12.32,12.02, and 11.86. Use this information and alpha risk of 0.06 to obtain control limits for means of future times. It is known from previous experience that the standard devlation of the process is 1.27 minute. STEP 1: Provide control limits for the mean chart: LCL=UCL= STEP 2: The inspector continued to periodically sample the process and recorded values for six samples as shown in the following table. Enter the values you plot in mean chart, starting from the first sample: Sample 1: Sample 2: Sample 3: Sample 4: Sample 5: Sample 6: Is the process in control (Enter YES or NO): NOTE: All computed values should be rounded to the nearest hundredth (two decimal after dot, for example 9.99) Step by Step Solution
There are 3 Steps involved in it
1 Expert Approved Answer
Step: 1 Unlock

Question Has Been Solved by an Expert!
Get step-by-step solutions from verified subject matter experts
Step: 2 Unlock
Step: 3 Unlock