Question: Is this Correct? I also need to write an executive summary for this If somebody could help me. Use the following monthly forecast to create
Is this Correct?
I also need to write an executive summary for this If somebody could help me.
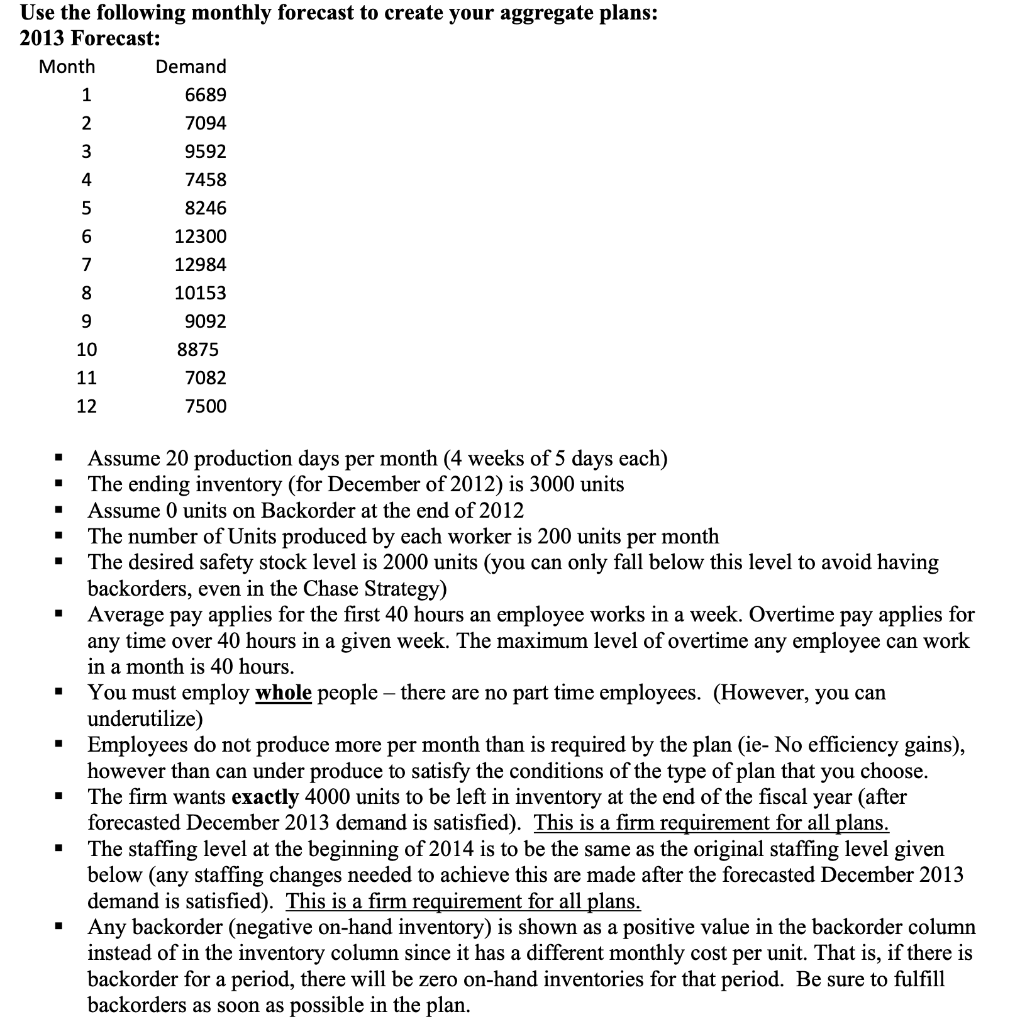
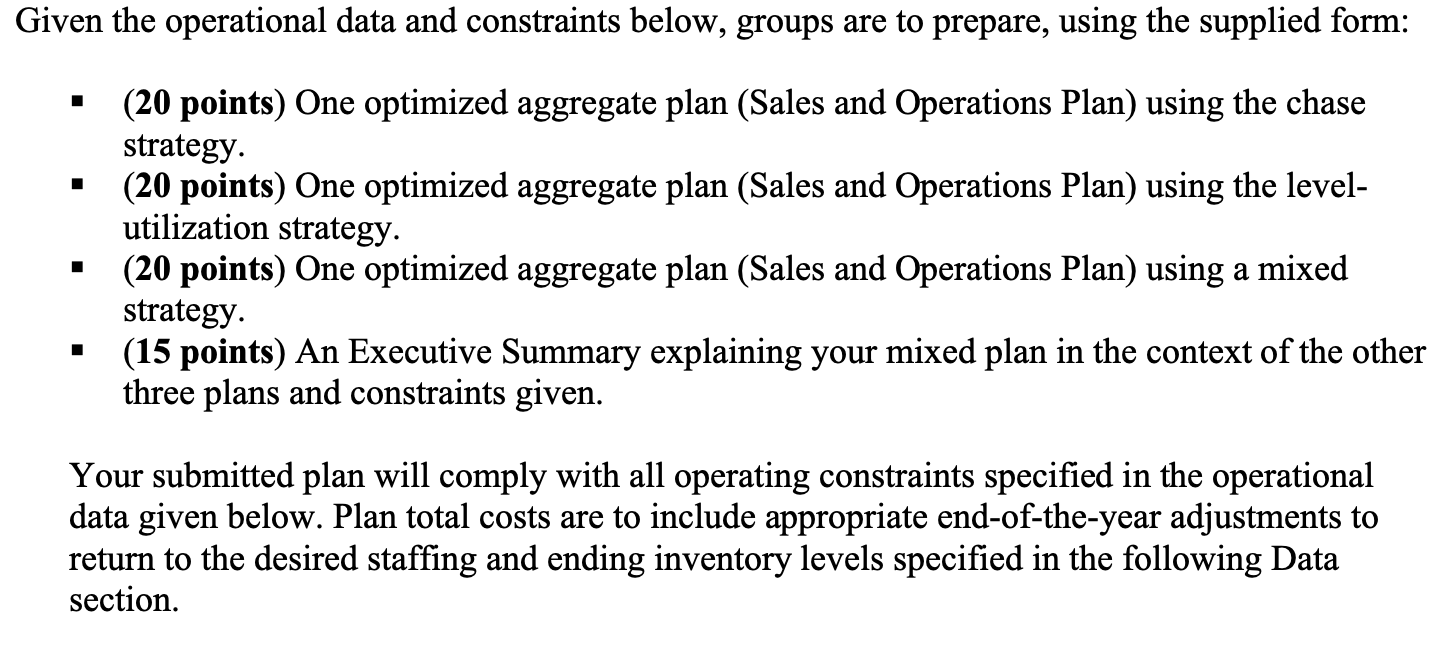
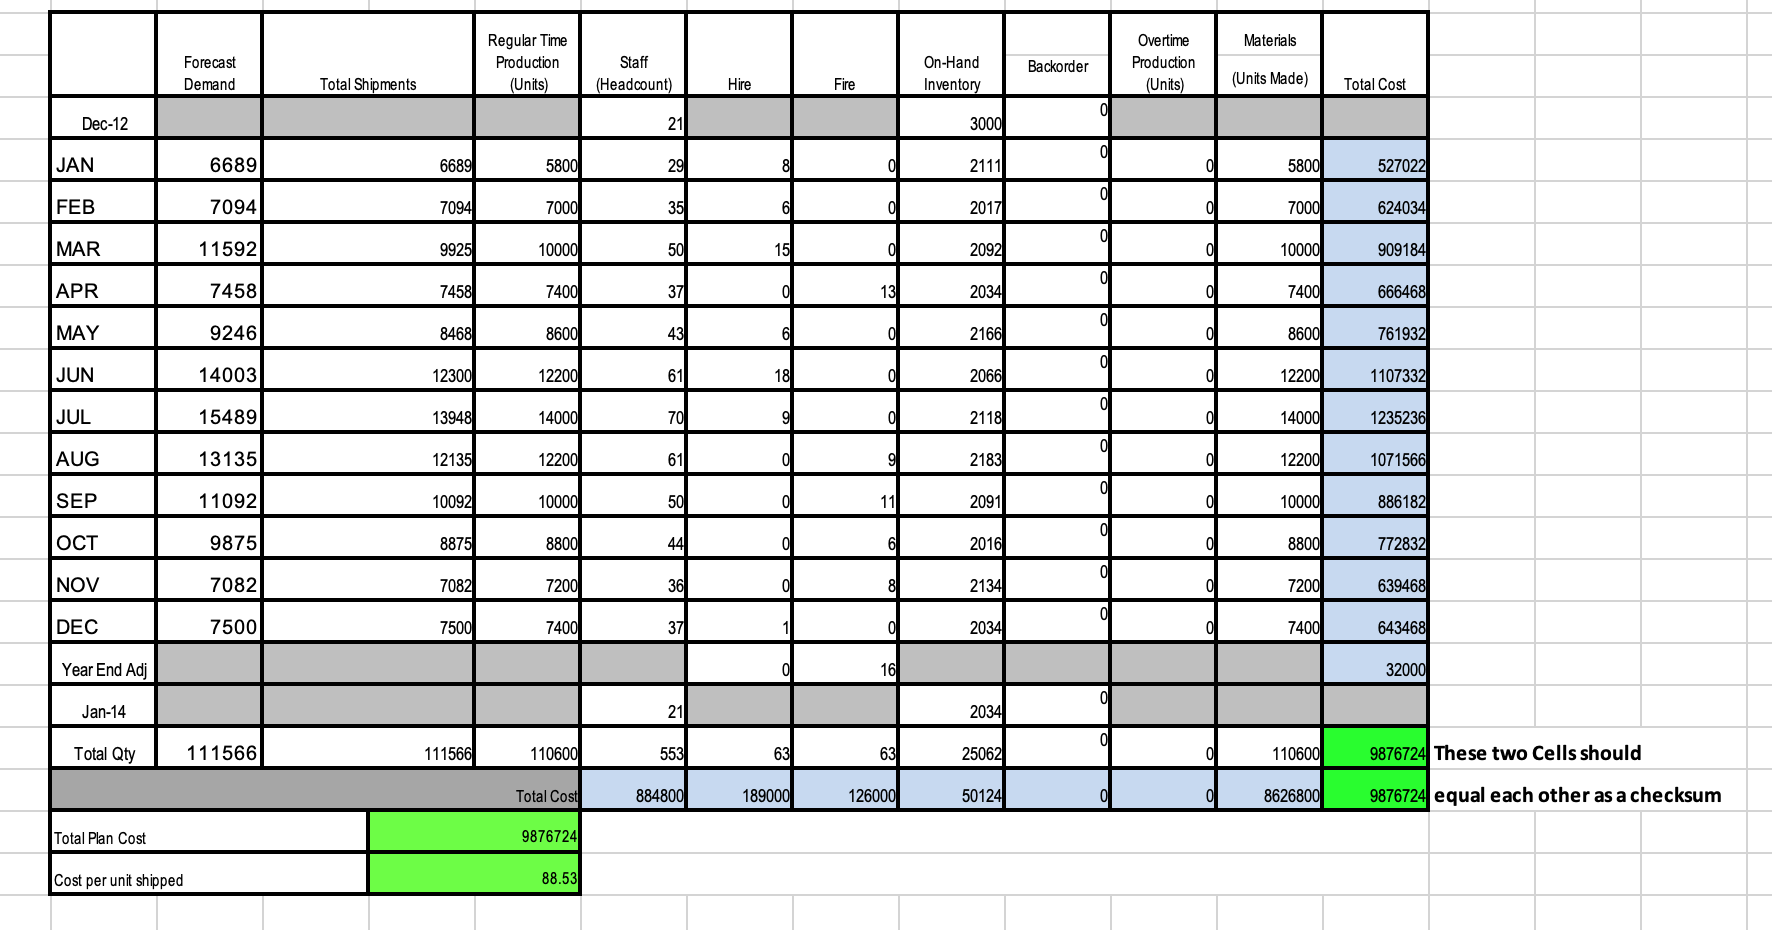
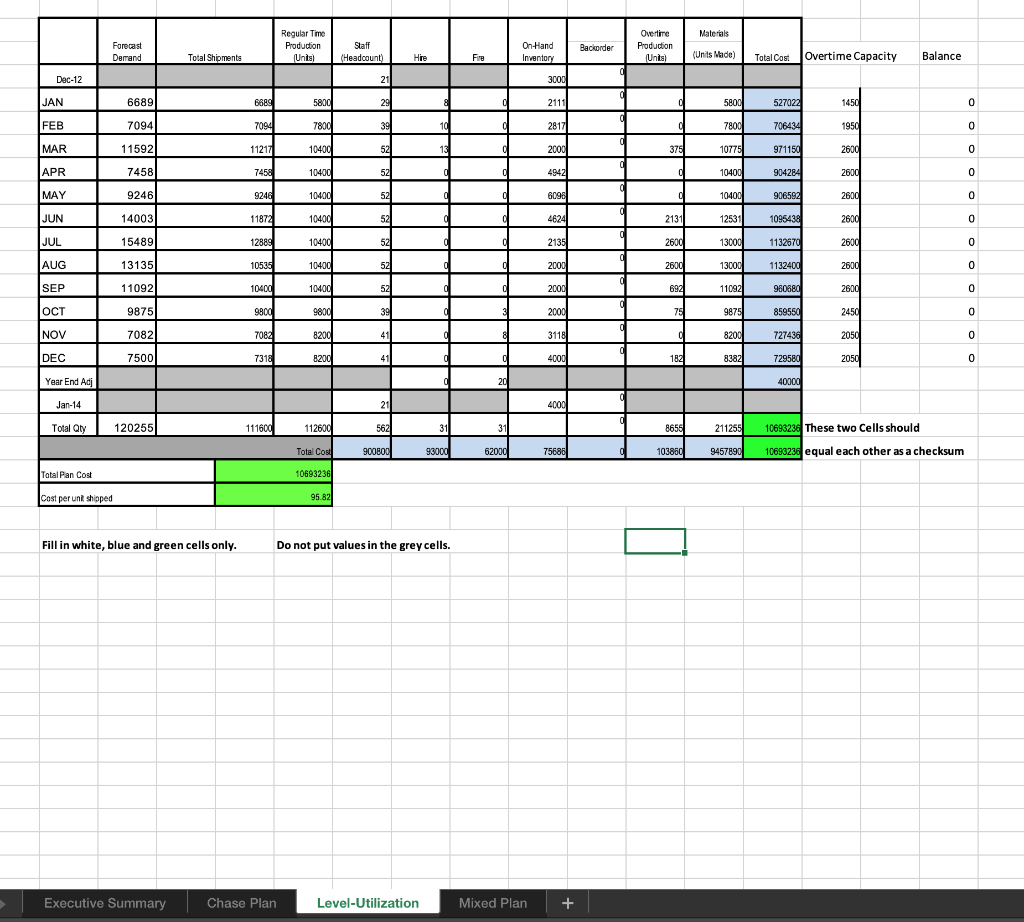
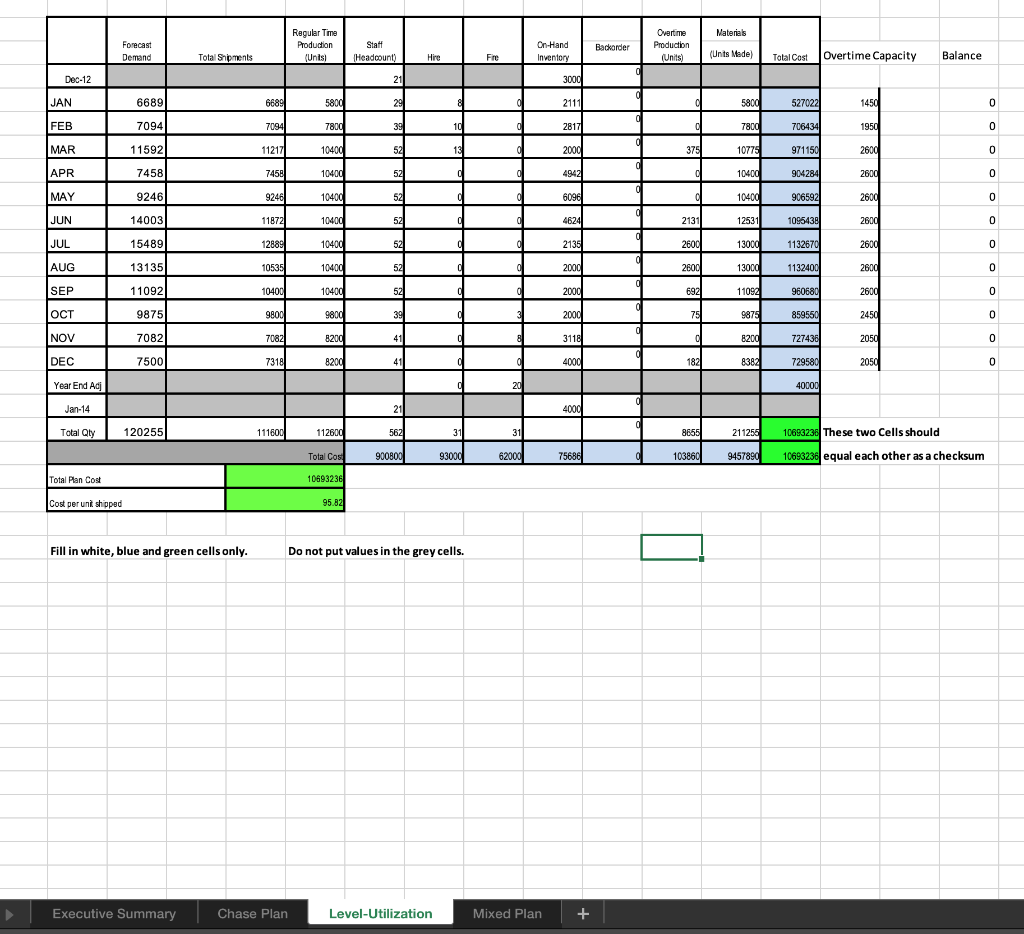
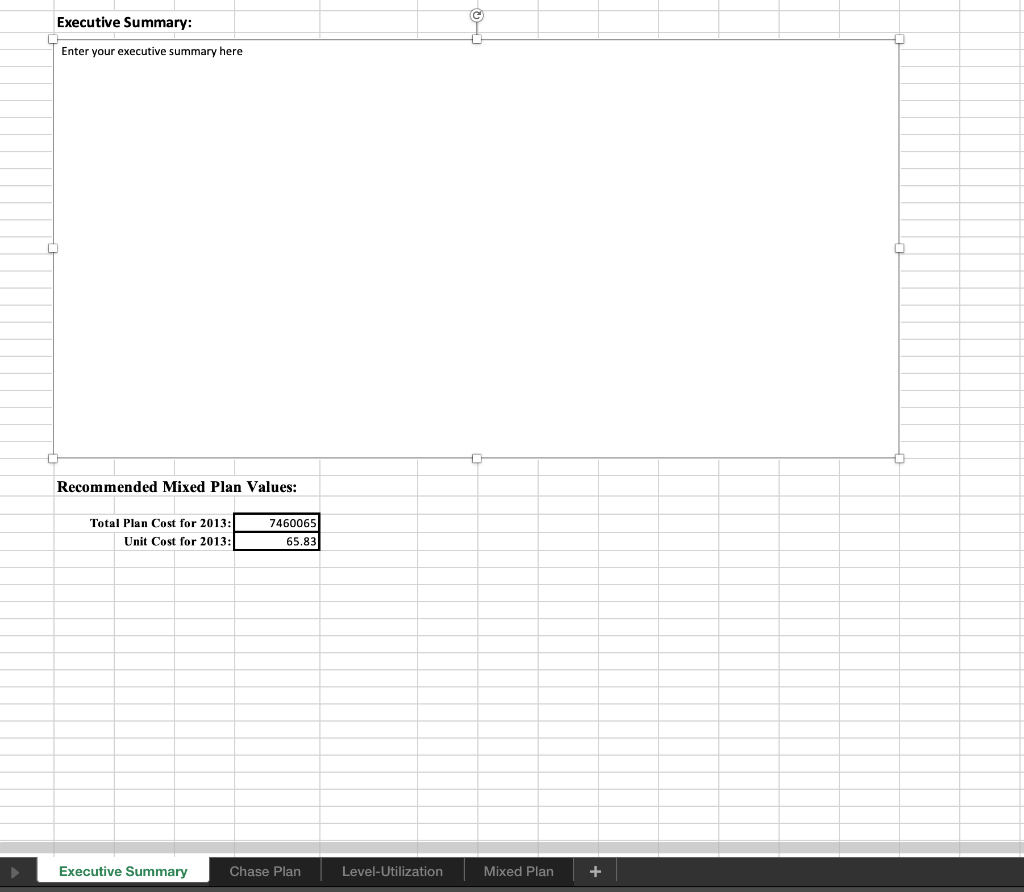
Use the following monthly forecast to create your aggregate plans: 2013 Forecast: Month Demand 1 6689 2 7094 3 9592 4 7458 5 8246 6 12300 7 12984 8 10153 9 9092 10 8875 11 7082 12 7500 Assume 20 production days per month (4 weeks of 5 days each) The ending inventory (for December of 2012) is 3000 units Assume 0 units on Backorder at the end of 2012 The number of Units produced by each worker is 200 units per month The desired safety stock level is 2000 units (you can only fall below this level to avoid having backorders, even in the Chase Strategy) Average pay applies for the first 40 hours an employee works in a week. Overtime pay applies for any time over 40 hours in a given week. The maximum level of overtime any employee can work in a month is 40 hours. You must employ whole people there are no part time employees. (However, you can underutilize) Employees do not produce more per month than is required by the plan (ie- No efficiency gains), however than can under produce to satisfy the conditions of the type of plan that you choose. The firm wants exactly 4000 units to be left in inventory at the end of the fiscal year (after forecasted December 2013 demand is satisfied). This is a firm requirement for all plans. The staffing level at the beginning of 2014 is to be the same as the original staffing level given below (any staffing changes need to achieve this are made after the forecasted December 2013 demand is satisfied). This is a firm requirement for all plans. Any backorder (negative on-hand inventory) is shown as a positive value in the backorder column instead of in the inventory column since it has a different monthly cost per unit. That is, if there is backorder for a period, there will be zero on-hand inventories for that period. Be sure to fulfill backorders as soon as possible in the plan. Given the operational data and constraints below, groups are to prepare, using the supplied form: (20 points) One optimized aggregate plan (Sales and Operations Plan) using the chase strategy. (20 points) One optimized aggregate plan (Sales and Operations Plan) using the level- utilization strategy. (20 points) One optimized aggregate plan (Sales and Operations Plan) using a mixed strategy (15 points) An Executive Summary explaining your mixed plan in the context of the other three plans and constraints given. 1 Your submitted plan will comply with all operating constraints specified in the operational data given below. Plan total costs are to include appropriate end-of-the-year adjustments to return to the desired staffing and ending inventory levels specified in the following Data section. Materials Materials Regular Time Production (Units) Forecast Demand Staff (Headcount) On-Hand Inventory Backorder Overtime Production (Units) Total Shipments Hire Fire (Units Made) Total Cost 0 Dec-12 21 3000 0 JAN 6689 6689 5800 29 8 0 2111 0 5800 527022 0 FEB 7094 7094 7000 35 6 0 2017 0 7000 624034 0 MAR 11592 9925 10000 50 151 0 2092 0 10000 909184 0 APR 7458 7458 7400 37 0 13 2034 0 7400 666468 0 MAY 9246 8468 8600 43 6 0 2166 0 8600 761932 0 JUN 14003 12300 12200 61 18 0 2066 0 12200 1107332 0 JUL 15489 13948 14000 70 9 0 2118 0 14000 1235236 0 AUG 13135 12135 12200 61 0 9 2183 0 12200 1071566 0 SEP 11092 10092 10000 50 0 11 2091 0 10000 886182 0 OCT 9875 8875 8800 44 0 61 2016 0 8800 772832 0 NOV 7082 7082 7200 36 8 2134 0 7200 639468 DEC 7500 7500 7400 37 0 2034 0 7400 643468 Year End Adj 16 32000 Jan-14 21 2034 Total Qty 111566 111566 110600 553 63 63 25062 0 110600 9876724 These two Cells should Total Cost 884800 189000 126000 50124 0 8626800 9876724 equal each other as a checksum Total Plan Cost 9876724 Cost per unit shipped 88.53 Materials Forecast Demand Regular Time Production Unis) Staff (Headcount) Backorder Overtime Production (Units) On Hand Inventory Total Shipments Hire Fire (Units Made) Total Cost Overtime Capacity Balance Dec-12 21 3000 JAN 6689 688 5800 29 8 2111 5800 527022 1450 0 FEB 7094 7094 7800 39 10 10 C 2817 C 7800 706434 1950 0 d MAR 11592 11217 10400) 52 15 2000 375 10775 971150 2600 0 APR 7458 7458 10400 52 4942 10400 904284 2600 0 MAY 9246 9246 10400 52 6096 10400 906592 2600 0 JUN 14003 11872 10400 52 4624 2131 2131 12531 1095438 2600 0 JUL 15489 12889 10400 52 2135 2600 13000 1132670 2600 0 AUG 13135 10536 10400 52 2000 2600 13000 1132400 2600 0 SEP 11092 10400 10400 52 2000 692 11092 980680 2600 0 OCT 9875 9800 9800 39 2000 78 9875 859550 2450 0 0 NOV 7082 7082 8200 41 3118 8200 727436 2050 0 DEC 7500 7318 8200 41 4000 1821 8382 729580 2050 0 Year End Ad 20 40000 o Jan-14 . 21 40001 Total Qty 120255 111600 112600 562 31 31 8656 211255 10693236 These two Cells should Total Cost 900800 93000 62000 75686 103850 9457890 10693238 e qual each other as a checksum Total Pan Cost 10693236 Cost per unt shipped 95.82 Fill in white, blue and green cells only. Do not put values in the grey cells. Executive Summary Chase Plan Level-Utilization Mixed Plan + Materials Regular Time Production ( (Untsi Forecast Demand Backorder Staff Headcount) Total Shipments Overtime Production (Units) On-Hand Inventory Hire Fire (Unts Made) Total Cost Overtime Capacity Balance Dec-12 21 3000 d JAN 6689 6689 5800 29 0 2111 5800 527022 1450 0 FEB 7094 7094 7800 39 10 0 2817 C 7800 7064341 1950 0 MAR 11592 11217 10400 52 13 2000 375 10775 971150 2600 0 APR 74581 7458 10400 52 52 4942 C 10400 904284 2600 0 MAY 9246) 9246 10400 52 6096 10400 906592 2600 0 JUN 14003 11872 10400 52 4624 2131 12531 1095438 2600 0 JUL 15489 12889 10400 52 0 2135 2600 13000 1132670 2600 0 AUG 13135 10535 10400 52 2000 2600 13000 1132400 2600 0 SEP 11092 10400 10400 52 2000 692 11092 960680 2600 0 OCT 9875 9800 9800 39 2000 75 9875 859550 2450 0 NOV 7082 7082 8200 41 3118 C 8200 727436 2050 0 DEC 75001 7318 8200 41 4000 182 8387 729580 2050 0 Year End Adi C 20 40000 0 Jan-14 21 4000 Total Qly 120255 111600 112600 562 31 31 8655 211256 10693238 These two Cells should 10693236 equal each other as a checksum Total Cos 900800 93000 62000 75686 103860 9457890 Total Plan Cou 10693236 Cost per unit shipped 95.82 Fill in white, blue and green cells only. Do not put values in the grey cells. Executive Summary Chase Plan Level-Utilization Mixed Plan + Executive Summary: Enter your executive summary here Recommended Mixed Plan Values: Total Plan Cost for 2013: Unit Cost for 2013: 7460065 65.83 Executive Summary Chase Plan Level-Utilization Mixed Plan + Use the following monthly forecast to create your aggregate plans: 2013 Forecast: Month Demand 1 6689 2 7094 3 9592 4 7458 5 8246 6 12300 7 12984 8 10153 9 9092 10 8875 11 7082 12 7500 Assume 20 production days per month (4 weeks of 5 days each) The ending inventory (for December of 2012) is 3000 units Assume 0 units on Backorder at the end of 2012 The number of Units produced by each worker is 200 units per month The desired safety stock level is 2000 units (you can only fall below this level to avoid having backorders, even in the Chase Strategy) Average pay applies for the first 40 hours an employee works in a week. Overtime pay applies for any time over 40 hours in a given week. The maximum level of overtime any employee can work in a month is 40 hours. You must employ whole people there are no part time employees. (However, you can underutilize) Employees do not produce more per month than is required by the plan (ie- No efficiency gains), however than can under produce to satisfy the conditions of the type of plan that you choose. The firm wants exactly 4000 units to be left in inventory at the end of the fiscal year (after forecasted December 2013 demand is satisfied). This is a firm requirement for all plans. The staffing level at the beginning of 2014 is to be the same as the original staffing level given below (any staffing changes need to achieve this are made after the forecasted December 2013 demand is satisfied). This is a firm requirement for all plans. Any backorder (negative on-hand inventory) is shown as a positive value in the backorder column instead of in the inventory column since it has a different monthly cost per unit. That is, if there is backorder for a period, there will be zero on-hand inventories for that period. Be sure to fulfill backorders as soon as possible in the plan. Given the operational data and constraints below, groups are to prepare, using the supplied form: (20 points) One optimized aggregate plan (Sales and Operations Plan) using the chase strategy. (20 points) One optimized aggregate plan (Sales and Operations Plan) using the level- utilization strategy. (20 points) One optimized aggregate plan (Sales and Operations Plan) using a mixed strategy (15 points) An Executive Summary explaining your mixed plan in the context of the other three plans and constraints given. 1 Your submitted plan will comply with all operating constraints specified in the operational data given below. Plan total costs are to include appropriate end-of-the-year adjustments to return to the desired staffing and ending inventory levels specified in the following Data section. Materials Materials Regular Time Production (Units) Forecast Demand Staff (Headcount) On-Hand Inventory Backorder Overtime Production (Units) Total Shipments Hire Fire (Units Made) Total Cost 0 Dec-12 21 3000 0 JAN 6689 6689 5800 29 8 0 2111 0 5800 527022 0 FEB 7094 7094 7000 35 6 0 2017 0 7000 624034 0 MAR 11592 9925 10000 50 151 0 2092 0 10000 909184 0 APR 7458 7458 7400 37 0 13 2034 0 7400 666468 0 MAY 9246 8468 8600 43 6 0 2166 0 8600 761932 0 JUN 14003 12300 12200 61 18 0 2066 0 12200 1107332 0 JUL 15489 13948 14000 70 9 0 2118 0 14000 1235236 0 AUG 13135 12135 12200 61 0 9 2183 0 12200 1071566 0 SEP 11092 10092 10000 50 0 11 2091 0 10000 886182 0 OCT 9875 8875 8800 44 0 61 2016 0 8800 772832 0 NOV 7082 7082 7200 36 8 2134 0 7200 639468 DEC 7500 7500 7400 37 0 2034 0 7400 643468 Year End Adj 16 32000 Jan-14 21 2034 Total Qty 111566 111566 110600 553 63 63 25062 0 110600 9876724 These two Cells should Total Cost 884800 189000 126000 50124 0 8626800 9876724 equal each other as a checksum Total Plan Cost 9876724 Cost per unit shipped 88.53 Materials Forecast Demand Regular Time Production Unis) Staff (Headcount) Backorder Overtime Production (Units) On Hand Inventory Total Shipments Hire Fire (Units Made) Total Cost Overtime Capacity Balance Dec-12 21 3000 JAN 6689 688 5800 29 8 2111 5800 527022 1450 0 FEB 7094 7094 7800 39 10 10 C 2817 C 7800 706434 1950 0 d MAR 11592 11217 10400) 52 15 2000 375 10775 971150 2600 0 APR 7458 7458 10400 52 4942 10400 904284 2600 0 MAY 9246 9246 10400 52 6096 10400 906592 2600 0 JUN 14003 11872 10400 52 4624 2131 2131 12531 1095438 2600 0 JUL 15489 12889 10400 52 2135 2600 13000 1132670 2600 0 AUG 13135 10536 10400 52 2000 2600 13000 1132400 2600 0 SEP 11092 10400 10400 52 2000 692 11092 980680 2600 0 OCT 9875 9800 9800 39 2000 78 9875 859550 2450 0 0 NOV 7082 7082 8200 41 3118 8200 727436 2050 0 DEC 7500 7318 8200 41 4000 1821 8382 729580 2050 0 Year End Ad 20 40000 o Jan-14 . 21 40001 Total Qty 120255 111600 112600 562 31 31 8656 211255 10693236 These two Cells should Total Cost 900800 93000 62000 75686 103850 9457890 10693238 e qual each other as a checksum Total Pan Cost 10693236 Cost per unt shipped 95.82 Fill in white, blue and green cells only. Do not put values in the grey cells. Executive Summary Chase Plan Level-Utilization Mixed Plan + Materials Regular Time Production ( (Untsi Forecast Demand Backorder Staff Headcount) Total Shipments Overtime Production (Units) On-Hand Inventory Hire Fire (Unts Made) Total Cost Overtime Capacity Balance Dec-12 21 3000 d JAN 6689 6689 5800 29 0 2111 5800 527022 1450 0 FEB 7094 7094 7800 39 10 0 2817 C 7800 7064341 1950 0 MAR 11592 11217 10400 52 13 2000 375 10775 971150 2600 0 APR 74581 7458 10400 52 52 4942 C 10400 904284 2600 0 MAY 9246) 9246 10400 52 6096 10400 906592 2600 0 JUN 14003 11872 10400 52 4624 2131 12531 1095438 2600 0 JUL 15489 12889 10400 52 0 2135 2600 13000 1132670 2600 0 AUG 13135 10535 10400 52 2000 2600 13000 1132400 2600 0 SEP 11092 10400 10400 52 2000 692 11092 960680 2600 0 OCT 9875 9800 9800 39 2000 75 9875 859550 2450 0 NOV 7082 7082 8200 41 3118 C 8200 727436 2050 0 DEC 75001 7318 8200 41 4000 182 8387 729580 2050 0 Year End Adi C 20 40000 0 Jan-14 21 4000 Total Qly 120255 111600 112600 562 31 31 8655 211256 10693238 These two Cells should 10693236 equal each other as a checksum Total Cos 900800 93000 62000 75686 103860 9457890 Total Plan Cou 10693236 Cost per unit shipped 95.82 Fill in white, blue and green cells only. Do not put values in the grey cells. Executive Summary Chase Plan Level-Utilization Mixed Plan + Executive Summary: Enter your executive summary here Recommended Mixed Plan Values: Total Plan Cost for 2013: Unit Cost for 2013: 7460065 65.83 Executive Summary Chase Plan Level-Utilization Mixed Plan +


