

Question: is this correct? The table below shows the GDP deflator and the CPI over the past five years. By what percentage did prices change between
is this correct?
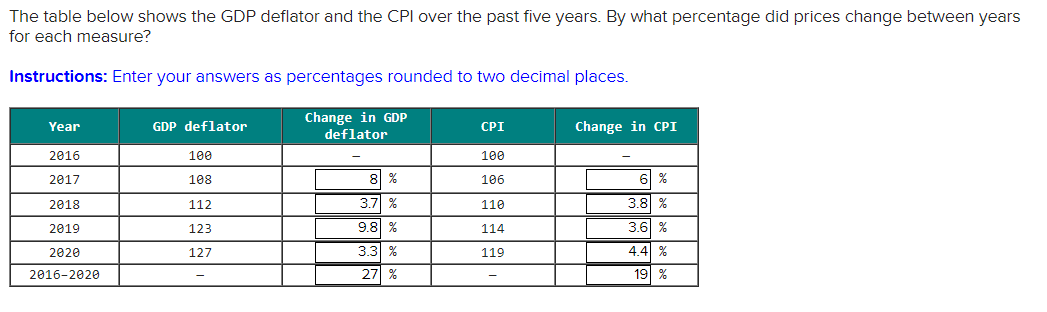
The table below shows the GDP deflator and the CPI over the past five years. By what percentage did prices change between years for each measure? Instructions: Enter your answers as percentages rounded to two decimal places. Year GDP deflator Change in GDP deflator CPI Change in CPI 2016 106 100 2017 108 8 106 6 2018 112 3.7 110 3.8 2019 123 9.8 114 3.6 2020 127 3.3 119 4.4 2016-2020 27 19
Step by Step Solution
There are 3 Steps involved in it
1 Expert Approved Answer
Step: 1 Unlock

Question Has Been Solved by an Expert!
Get step-by-step solutions from verified subject matter experts
Step: 2 Unlock
Step: 3 Unlock