

Question: is this right? 8. The table below provides the average monthly temperature in Niagara, Ontario over the course of a year. Month Temperature C January
is this right?
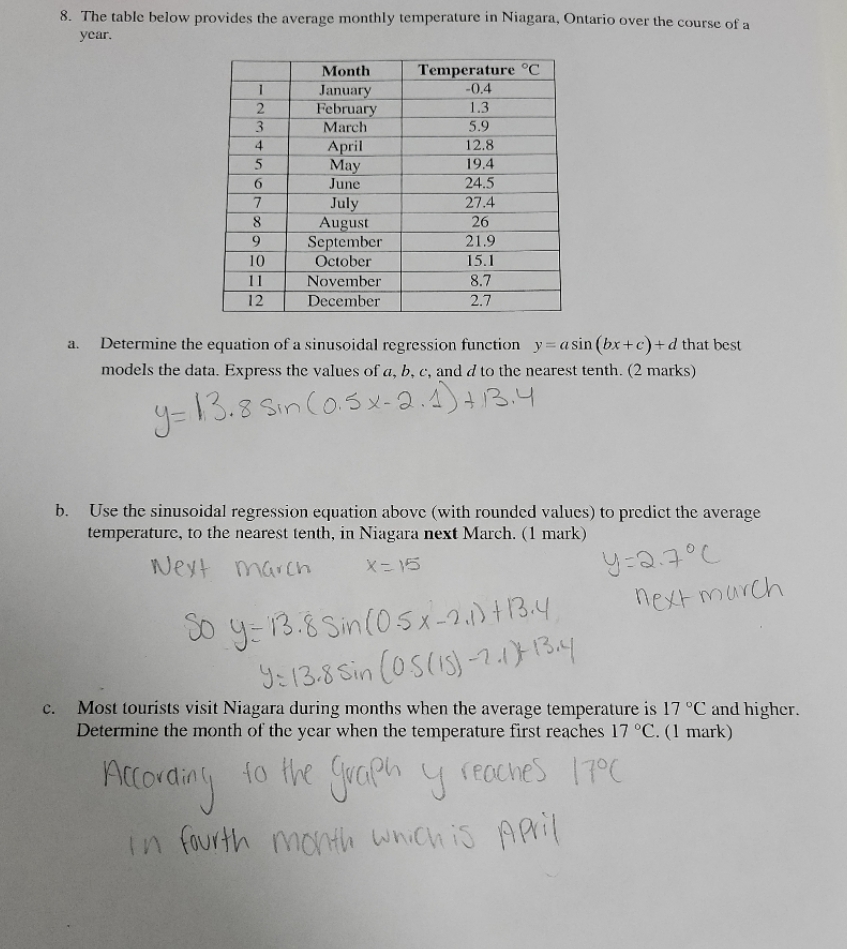
8. The table below provides the average monthly temperature in Niagara, Ontario over the course of a year. Month Temperature "C January -0.4 February 1.3 March 5.9 April 12.8 May 19.4 June 24.5 July 27.4 August 26 September 21.9 10 October 15.1 11 November 8.7 12 December 2.7 a. Determine the equation of a sinusoidal regression function y = asin (bx +c) +d that best models the data. Express the values of a, b, c, and d to the nearest tenth. (2 marks) y= 13.8 Sin (0.5 x-2. 1) + 13.4 b. Use the sinusoidal regression equation above (with rounded values) to predict the average temperature, to the nearest tenth, in Niagara next March. (1 mark) Next march X = 15 next march so y= 13.8 Sin (05 x- 2.1) +13.4 y= 13.8 sin (OS ( 15) - 2.1)- 13:4 c. Most tourists visit Niagara during months when the average temperature is 17 "C and higher. Determine the month of the year when the temperature first reaches 17 "C. (1 mark) According to the graph y reaches 170C in fourth month which is April
Step by Step Solution
There are 3 Steps involved in it

Get step-by-step solutions from verified subject matter experts