

Question: is this right and I need help with the ratios Financial Statement Analysis Excel Problem Follow the directions on each tab to prepare the information
is this right and I need help with the ratios
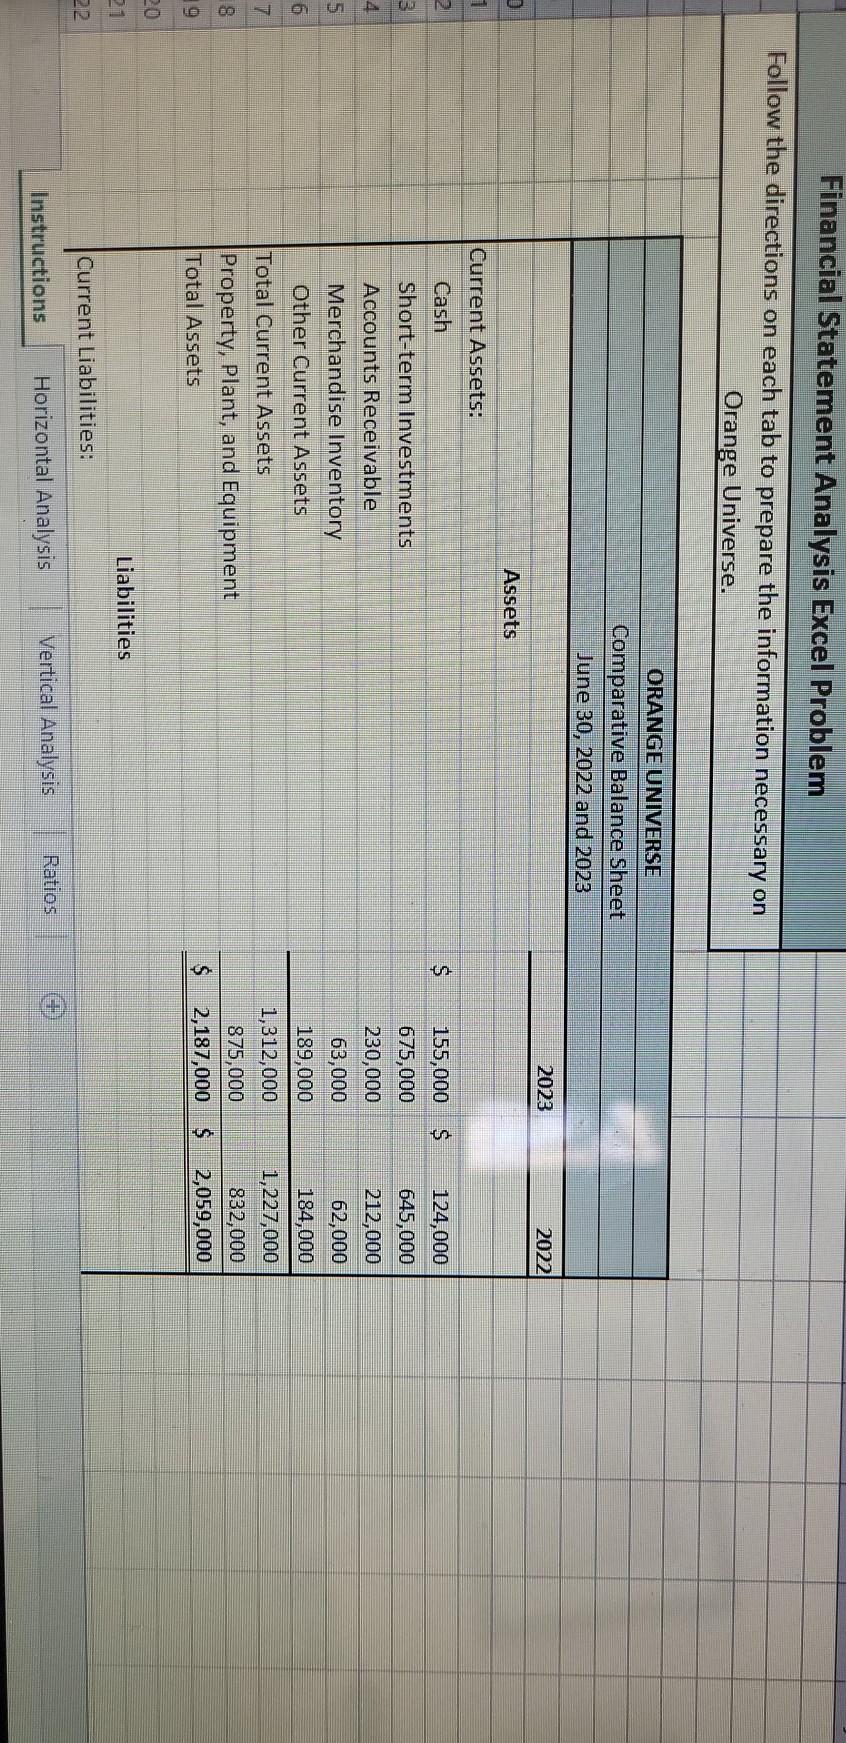
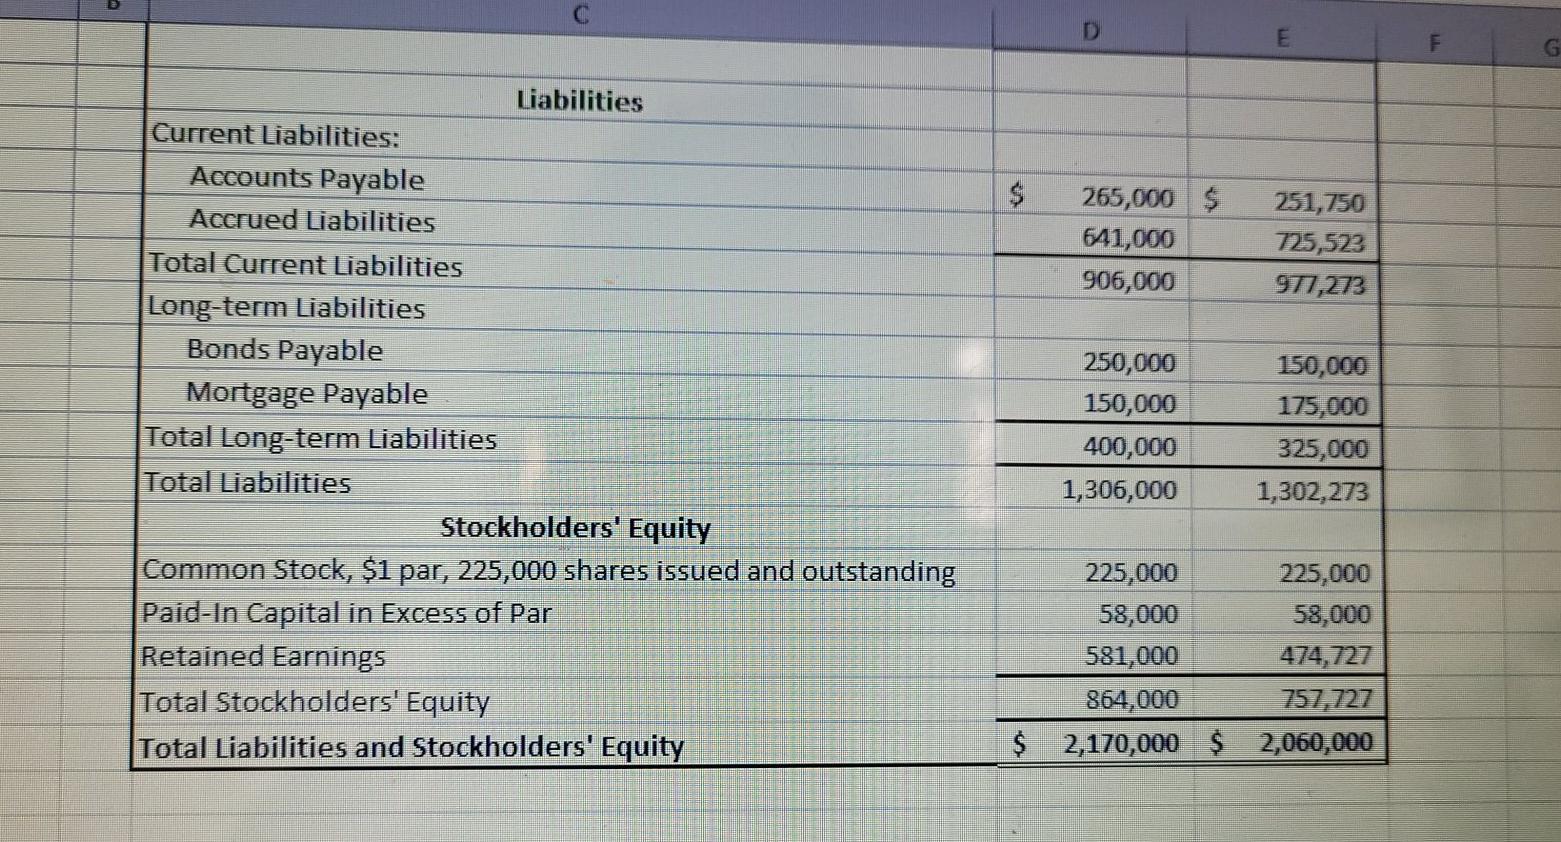
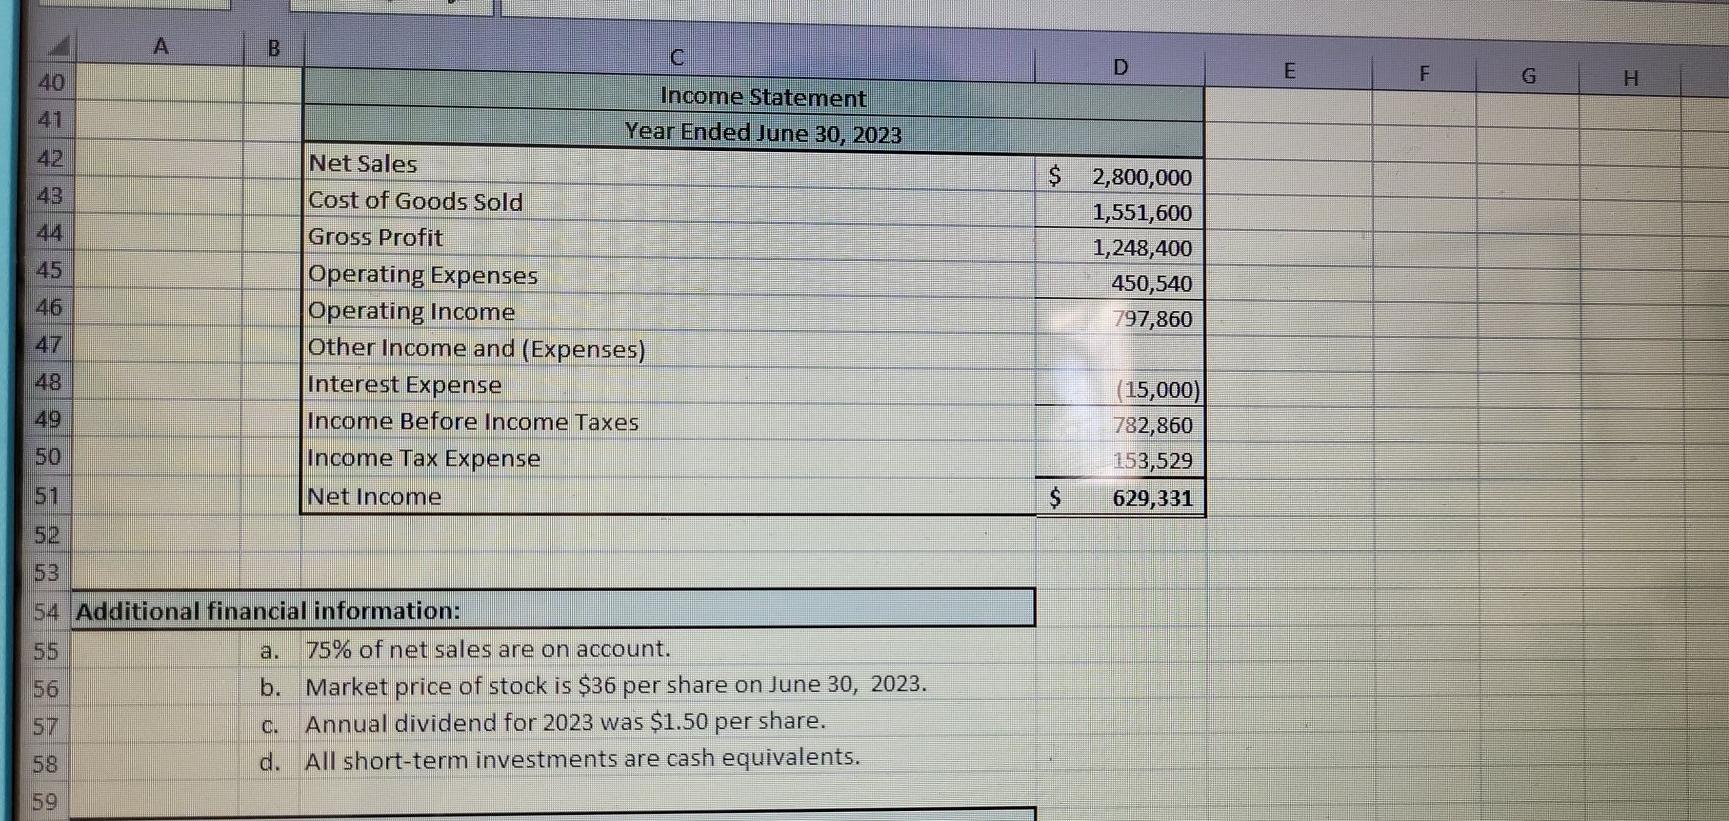
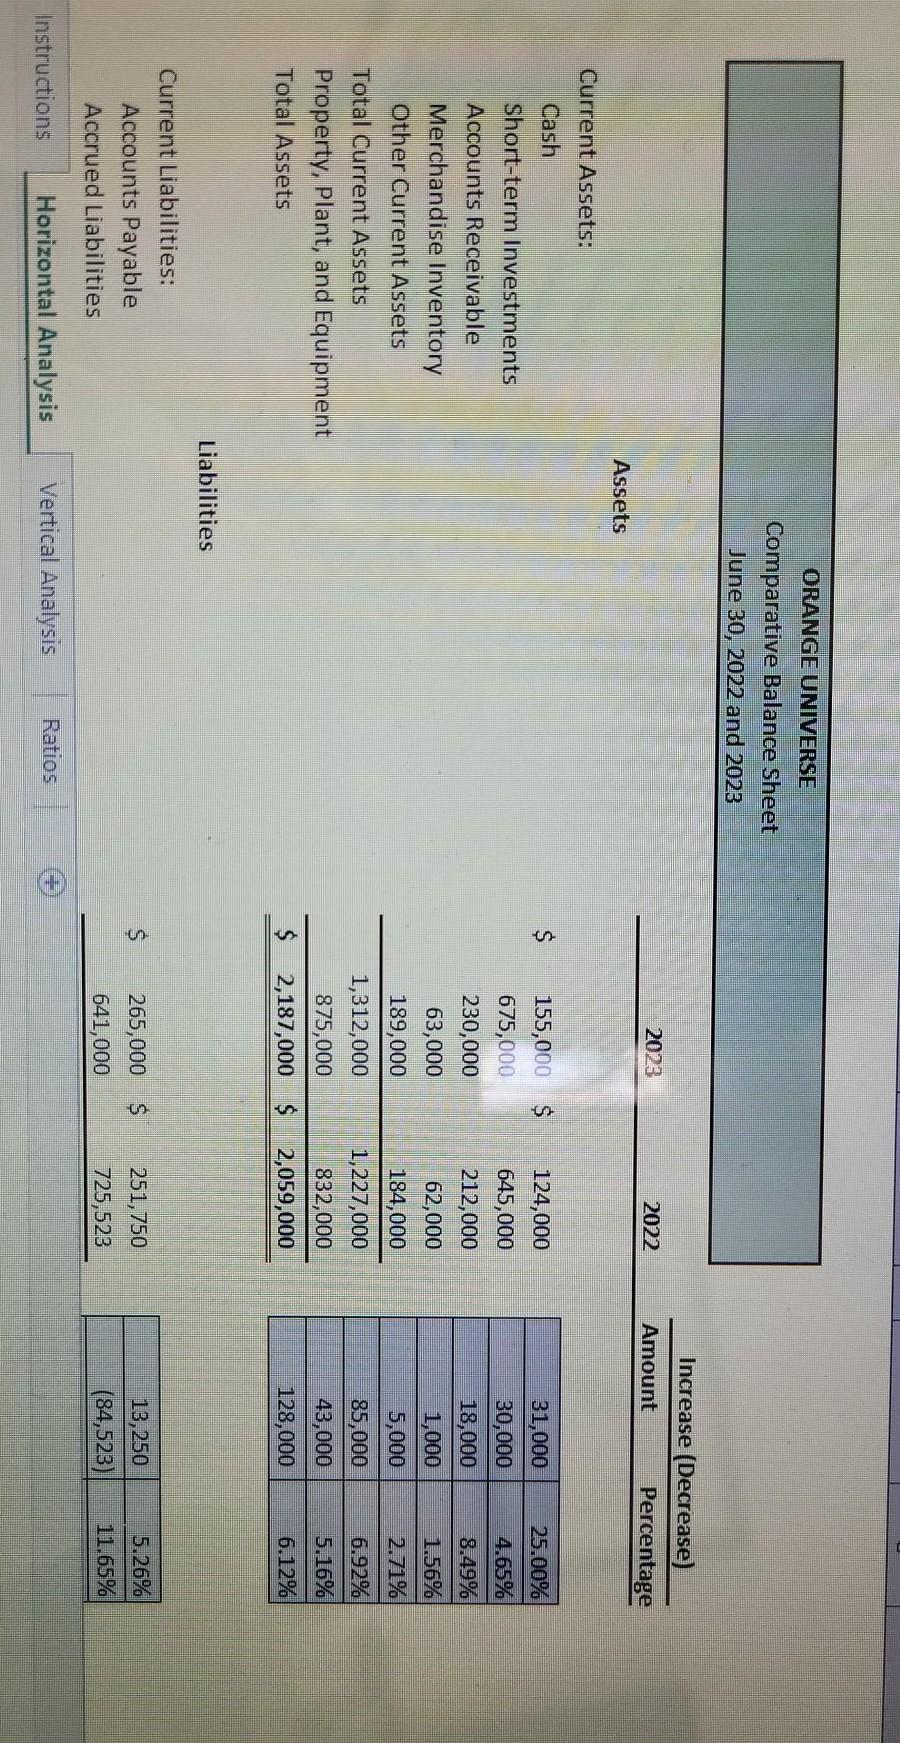
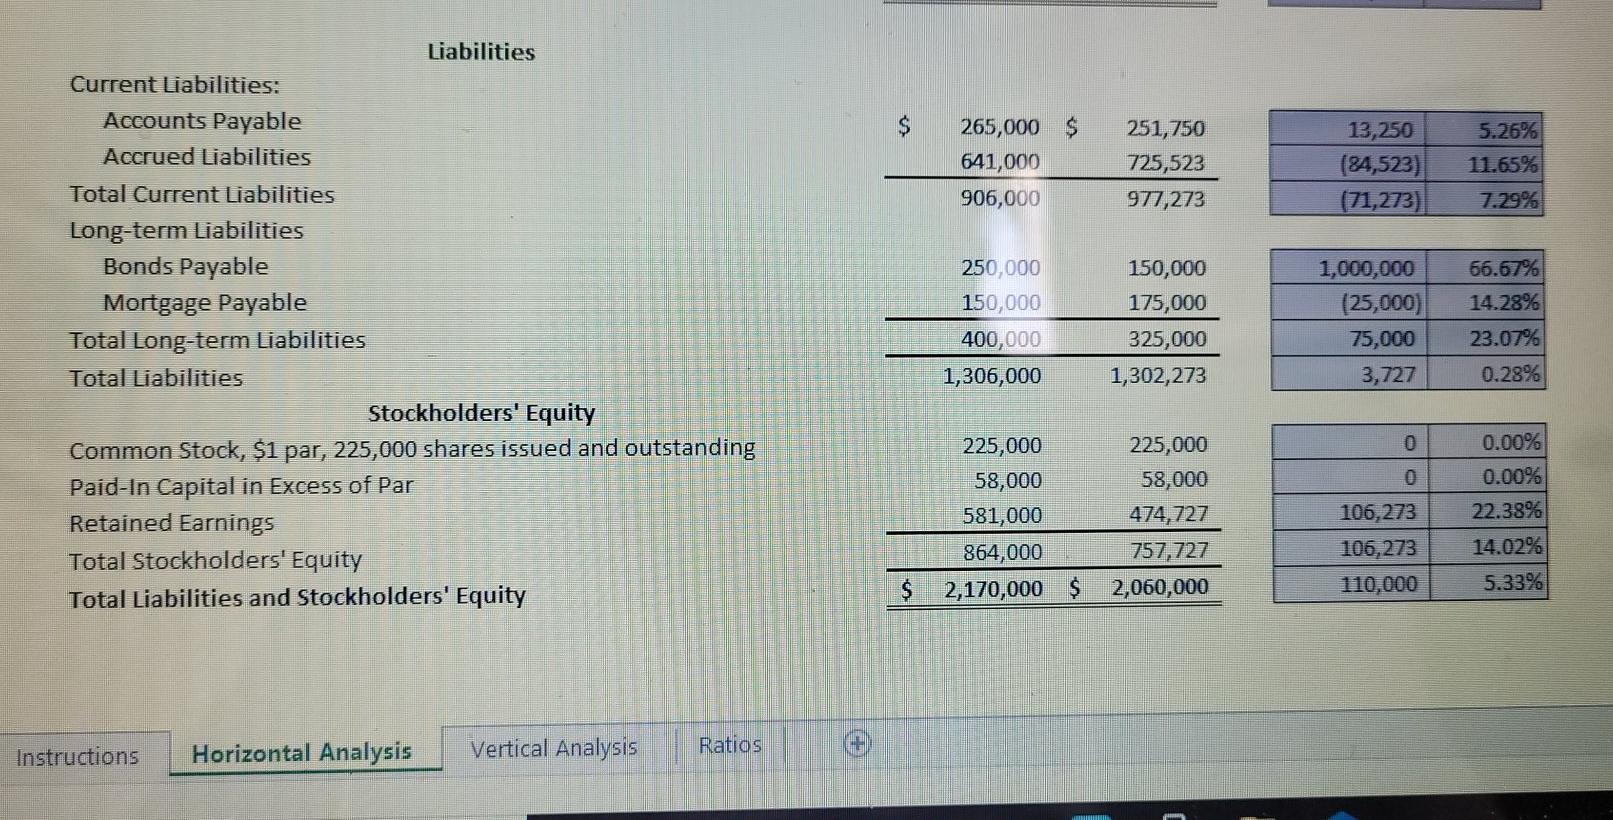
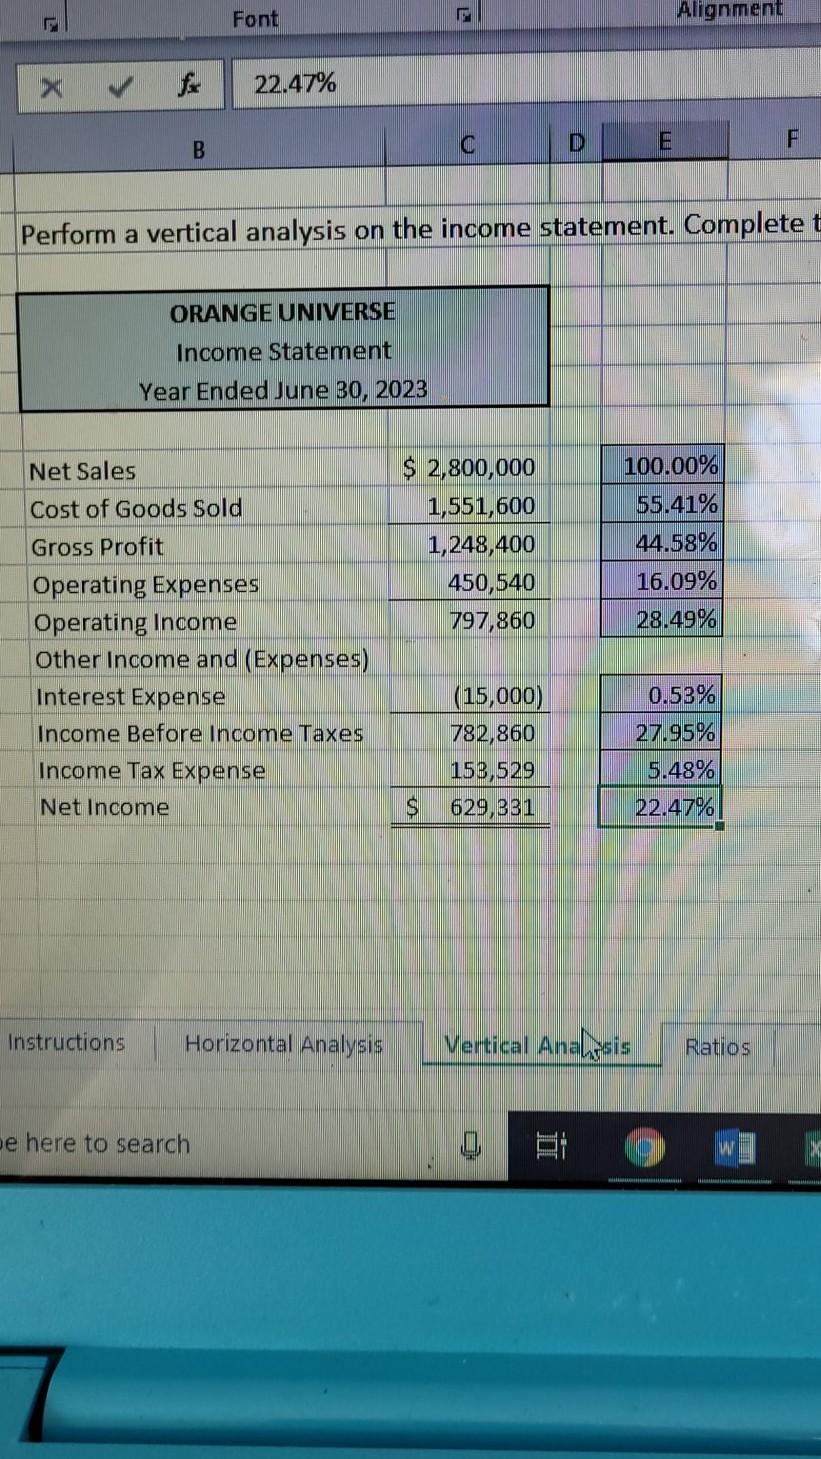
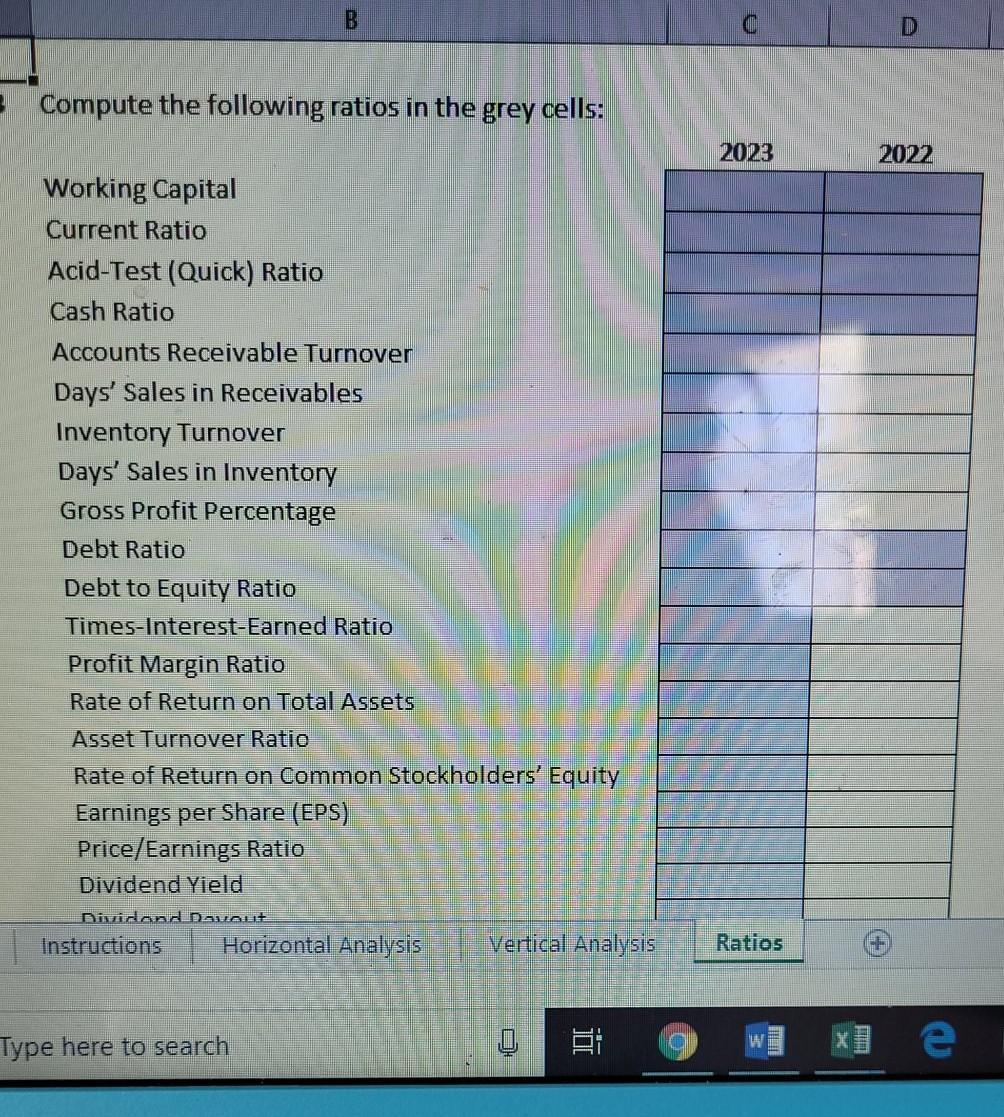
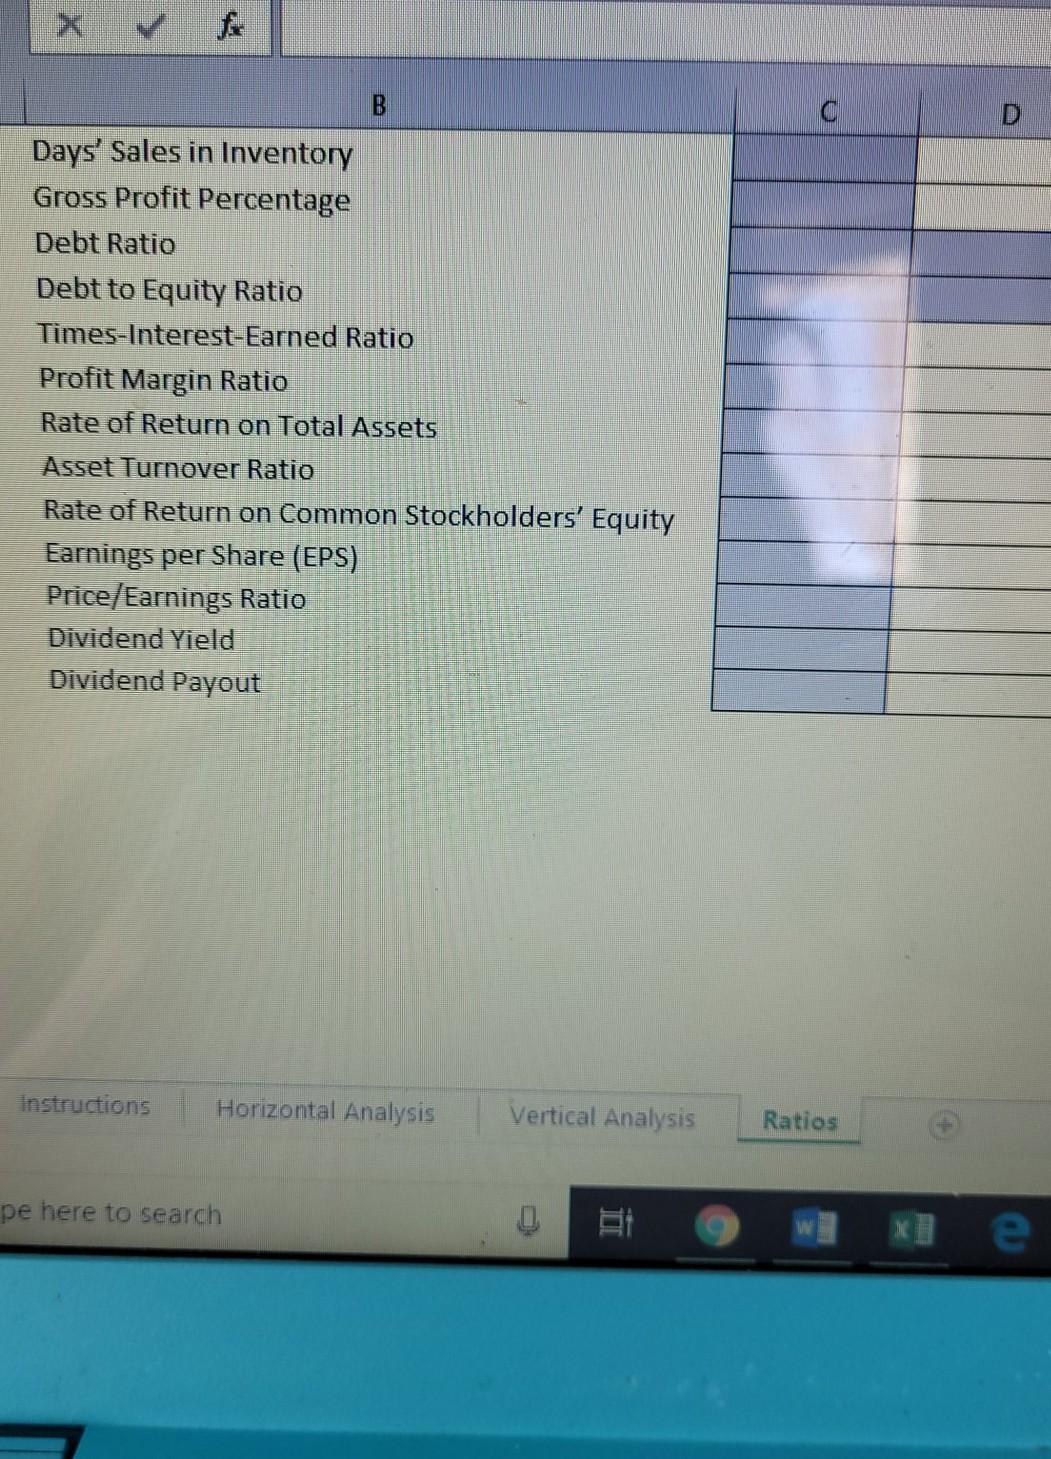
Financial Statement Analysis Excel Problem Follow the directions on each tab to prepare the information necessary on Orange Universe. ORANGE UNIVERSE Comparative Balance Sheet June 30, 2022 and 2023 2023 2022 Assets 1 2 $ Current Assets: Cash Short-term Investments Accounts Receivable Merchandise Inventory Other Current Assets 4 5 155,000 $ 675,000 230,000 63,000 189,000 1,312,000 875,000 2,187,000 $ 124,000 645,000 212,000 62,000 184,000 1,227,000 832,000 2,059,000 6 7 Total Current Assets Property, Plant, and Equipment Total Assets $ 20 Liabilities Current Liabilities: Instructions Horizontal Analysis Ratios Vertical Analysis E G $ 265,000 $ 641,000 906,000 251,750 725,523 977,273 Liabilities Current Liabilities: Accounts Payable Accrued Liabilities Total Current Liabilities Long-term Liabilities Bonds Payable Mortgage Payable Total Long-term Liabilities Total Liabilities Stockholders' Equity Common Stock, $1 par, 225,000 shares issued and outstanding Paid-In Capital in Excess of Par Retained Earnings Total Stockholders' Equity Total Liabilities and Stockholders' Equity 250,000 150,000 400,000 1,306,000 150,000 175,000 325,000 1,302,273 225,000 225,000 58,000 58,000 581,000 474,727 864,000 757,727 $ 2,170,000 $2,060,000 A B C D E 40 F H 41 42 43 44 Income Statement Year Ended June 30, 2023 Net Sales Cost of Goods Sold Gross Profit Operating Expenses Operating Income Other Income and (Expenses) Interest Expense Income Before Income Taxes Income Tax Expense Net Income $ 2,800,000 1,551,600 1,248,400 450,540 797,860 45 46 47 48 50 (15,000) 782,860 15 629,331 51 $ 52 53 54 Additional financial information: 55 56 75% of net sales are on account. b. Market price of stock is $36 per share on June 30, 2023. Annual dividend for 2023 was $1.50 per share. d. All short-term investments are cash equivalents. 0. 58 59 ORANGE UNIVERSE Comparative Balance Sheet June 30, 2022 and 2023 Increase (Decrease) Amount Percentage 2023 2022 Assets $ Current Assets: Cash Short-term Investments Accounts Receivable Merchandise Inventory Other Current Assets Total Current Assets Property, plant, and Equipment Total Assets 155,000 $ 675,000 230,000 63,000 189,000 1,312,000 875,000 $ 2,187,000 $ 124,000 645,000 212,000 62,000 184,000 1,227,000 832,000 2,059,000 31,000 30,000 18,000 1,000 5,000 85,000 43,000 128,000 25.00% 4.65% 8.49% 1.56% 2.71% 6.92% 5.16% 6.12% Liabilities Current Liabilities: Accounts Payable Accrued Liabilities $ 265,000 $ 641,000 251,750 725,523 13,250 (84,523) 5.26% 11.65% Instructions Horizontal Analysis Vertical Analysis Ratios 265,000 $ 641,000 906,000 251,750 725,523 977,273 13,250 (84,523) (71,273) 5.26% 11.65% 7.29% 66.67% Liabilities Current Liabilities: Accounts Payable Accrued Liabilities Total Current Liabilities Long-term Liabilities Bonds Payable Mortgage Payable Total Long-term Liabilities Total Liabilities Stockholders' Equity Common Stock, $1 par, 225,000 shares issued and outstanding Paid-In Capital in Excess of Par Retained Earnings Total Stockholders' Equity Total Liabilities and Stockholders' Equity 250,000 150,000 400,000 1,306,000 150,000 175,000 325,000 1,302,273 1,000,000 (25,000) 75,000 3,727 14.28% 23.07% 0.28% 0 225,000 225,000 58,000 58,000 581,000 474,727 864,000 757,727 $ 2,170,000 $ 2,060,000 0.00% 0.00% 22.38% 106,273 106,273 110,000 14.02% 5.33% Instructions Horizontal Analysis Ratios Vertical Analysis Font Alignment F 22.47% C B D F Perform a vertical analysis on the income statement. Complete t ORANGE UNIVERSE Income Statement Year Ended June 30, 2023 100.00% Net Sales Cost of Goods Sold $ 2,800,000 1,551,600 1,248,400 450,540 797,860 55.41% 44.58% 16.09% 28.49% Gross Profit Operating Expenses Operating Income Other Income and (Expenses) Interest Expense Income Before Income Taxes Income Tax Expense Net Income 0.53% 27.95% (15,000) 782,860 153,529 $ 629,331 5.48% 22.47% Instructions Horizontal Analysis Vertical Analisis Ratios e here to search BI B D Compute the following ratios in the grey cells: 2023 2022 Working Capital Current Ratio Acid-Test (Quick) Ratio Cash Ratio Accounts Receivable Turnover Days' Sales in Receivables Inventory Turnover Days' Sales in Inventory Gross Profit Percentage Debt Ratio Debt to Equity Ratio Times-Interest-Earned Ratio Profit Margin Ratio Rate of Return on Total Assets Asset Turnover Ratio Rate of Return on Common Stockholders' Equity Earnings per Share (EPS) Price/Earnings Ratio Dividend Yield Dividend Davaut Instructions Horizontal Analysis Vertical Analysis Ratios Type here to search in e B C Days' Sales in Inventory Gross Profit Percentage Debt Ratio Debt to Equity Ratio Times-Interest-Earned Ratio Profit Margin Ratio Rate of Return on Total Assets Asset Turnover Ratio Rate of Return on Common Stockholders' Equity Earnings per Share (EPS) Price/Earnings Ratio Dividend Yield Dividend Payout Instructions Horizontal Analysis Vertical Analysis Ratios pe here to search D e
Step by Step Solution
There are 3 Steps involved in it

Get step-by-step solutions from verified subject matter experts