

Question: Financial Statement Analysis Excel Problem Follow the directions on each tab to prepare the information necessary on Orange Universe. ORANGE UNIVERSE Comparative Balance Sheet June
Financial Statement Analysis Excel Problem Follow the directions on each tab to prepare the information necessary on Orange Universe.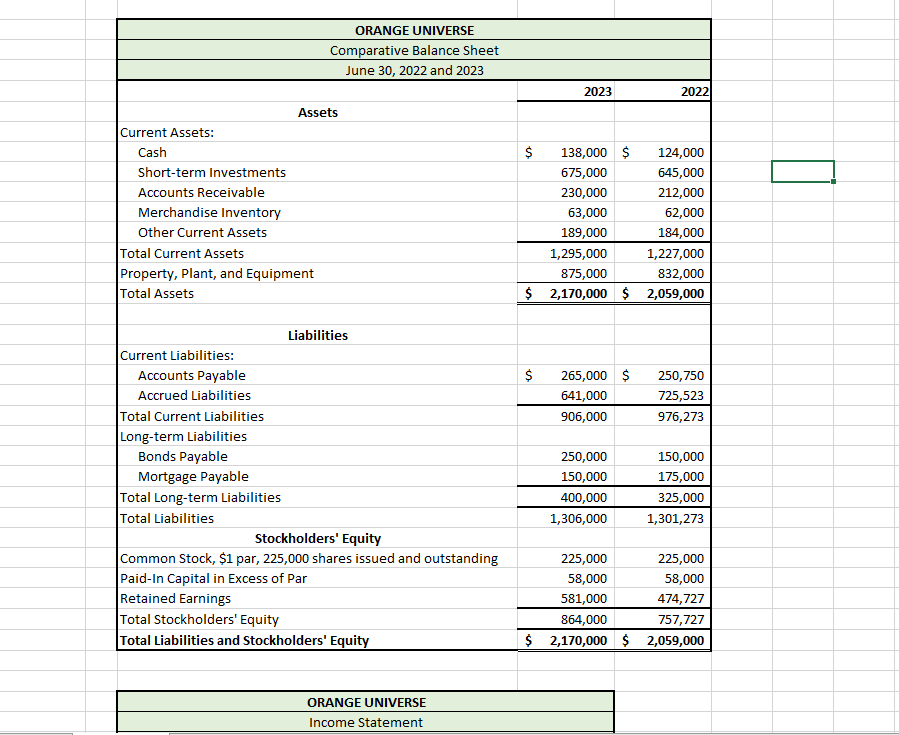
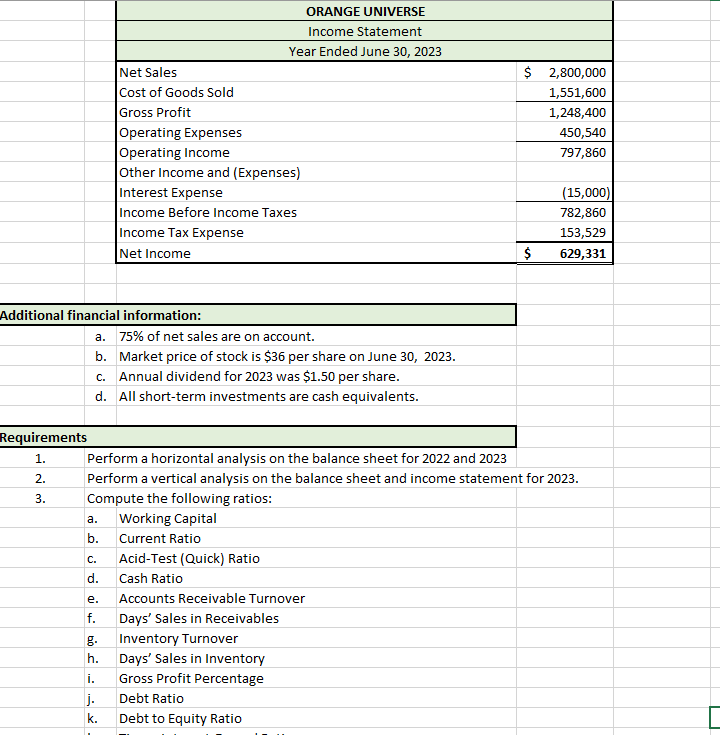
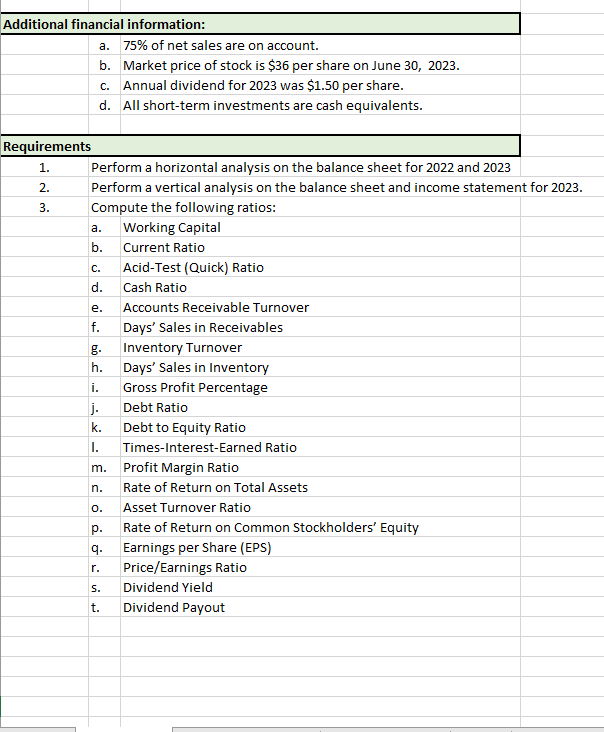
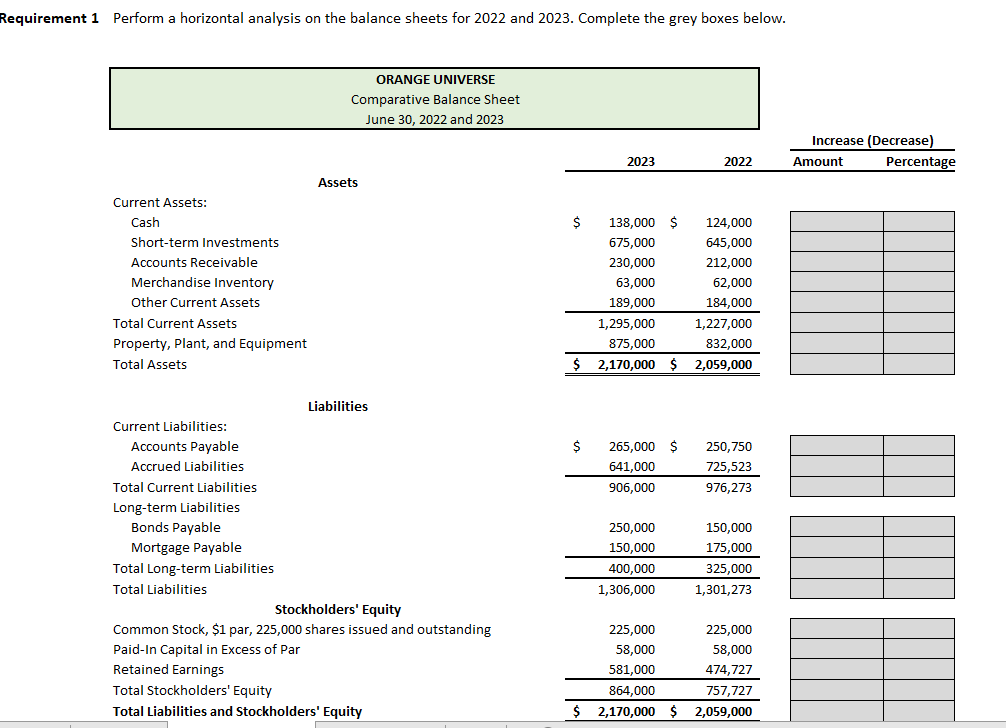
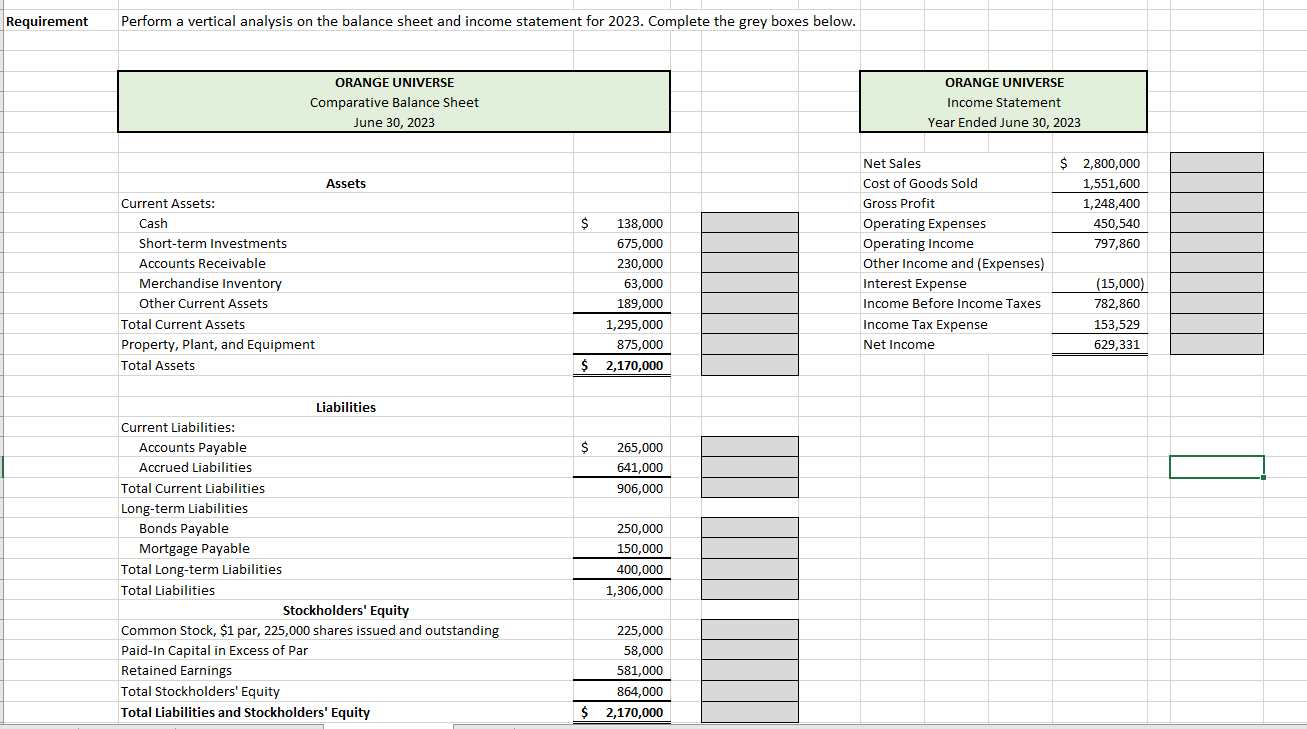
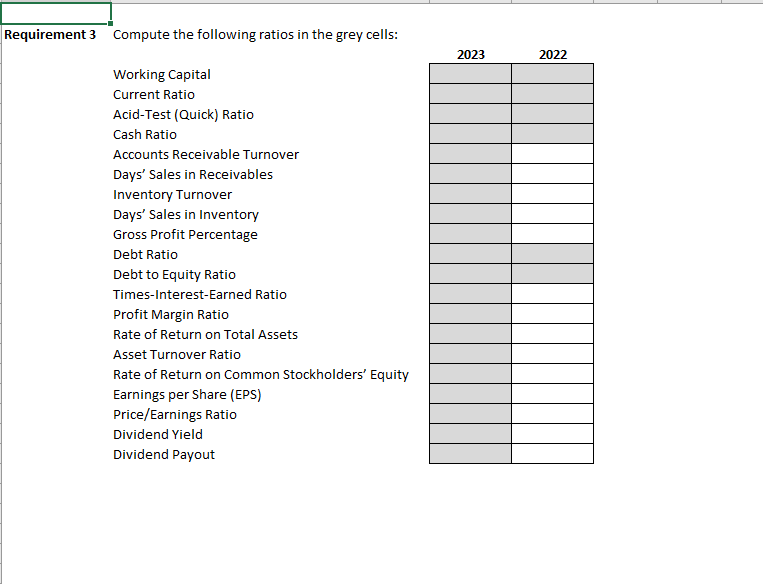
ORANGE UNIVERSE Comparative Balance Sheet June 30, 2022 and 2023 2023 2022 Assets Current Assets: Cash Short-term Investments Accounts Receivable Merchandise Inventory Other Current Assets Total Current Assets Property, Plant, and Equipment Total Assets $ 138,000 $ 124,000 675,000 645,000 230,000 212,000 63,000 62,000 189,000 184,000 1,295,000 1,227,000 875,000 832,000 $ 2,170,000 $2,059,000 $ 265,000 $ 641,000 906,000 250,750 725,523 976,273 Liabilities Current Liabilities: Accounts Payable Accrued Liabilities Total Current Liabilities Long-term Liabilities Bonds Payable Mortgage Payable Total Long-term Liabilities Total Liabilities Stockholders' Equity Common Stock, $1 par, 225,000 shares issued and outstanding Paid-In Capital in Excess of Par Retained Earnings Total Stockholders' Equity Total Liabilities and Stockholders' Equity 250,000 150,000 400,000 1,306,000 150,000 175,000 325,000 1,301,273 225,000 225,000 58,000 58,000 581,000 474,727 864,000 757,727 $ 2,170,000 $ 2,059,000 ORANGE UNIVERSE Income Statement ORANGE UNIVERSE Income Statement Year Ended June 30, 2023 Net Sales Cost of Goods Sold Gross Profit Operating Expenses Operating Income Other Income and (Expenses) Interest Expense Income Before Income Taxes Income Tax Expense Net Income $ 2,800,000 1,551,600 1,248,400 450,540 797,860 (15,000) 782,860 153,529 629,331 $ Additional financial information: a. 75% of net sales are on account. b. Market price of stock is $36 per share on June 30, 2023. C. Annual dividend for 2023 was $1.50 per share. d. All short-term investments are cash equivalents. a. C. Requirements 1. Perform a horizontal analysis on the balance sheet for 2022 and 2023 2. Perform a vertical analysis on the balance sheet and income statement for 2023. 3. Compute the following ratios: Working Capital b. Current Ratio Acid-Test (Quick) Ratio d. Cash Ratio Accounts Receivable Turnover f. Days' Sales in Receivables Inventory Turnover h. Days' Sales in Inventory i. Gross Profit Percentage j. Debt Ratio k. Debt to Equity Ratio . e. Additional financial information: a. 75% of net sales are on account. b. Market price of stock is $36 per share on June 30, 2023. c. Annual dividend for 2023 was $1.50 per share. d. All short-term investments are cash equivalents. 2. 3. a. C. e. Requirements 1. Perform a horizontal analysis on the balance sheet for 2022 and 2023 Perform a vertical analysis on the balance sheet and income statement for 2023. Compute the following ratios: Working Capital b. Current Ratio Acid-Test (Quick) Ratio d. Cash Ratio Accounts Receivable Turnover f. Days' Sales in Receivables Inventory Turnover h. Days' Sales in Inventory Gross Profit Percentage j. Debt Ratio k. Debt to Equity Ratio I. Times-Interest-Earned Ratio m. Profit Margin Ratio n. Rate of Return on Total Assets Asset Turnover Ratio Rate of Return on Common Stockholders' Equity q. Earnings per Share (EPS) Price/Earnings Ratio Dividend Yield Dividend Payout i. 0. p. r. s. t. Requirement 1 Perform a horizontal analysis on the balance sheets for 2022 and 2023. Complete the grey boxes below. ORANGE UNIVERSE Comparative Balance Sheet June 30, 2022 and 2023 Increase (Decrease) Amount Percentage 2023 2022 Assets Current Assets: Cash Short-term Investments Accounts Receivable Merchandise Inventory Other Current Assets Total Current Assets Property, Plant, and Equipment Total Assets $ $ 138,000 $ 124,000 675,000 645,000 230,000 212,000 63,000 62,000 189,000 184,000 1,295,000 1,227,000 875,000 832,000 $ 2,170,000 $2,059,000 $ 265,000 $ 641,000 906,000 250, 750 725,523 976,273 Liabilities Current Liabilities: Accounts Payable Accrued Liabilities Total Current Liabilities Long-term Liabilities Bonds Payable Mortgage Payable Total Long-term Liabilities Total Liabilities Stockholders' Equity Common Stock, $1 par, 225,000 shares issued and outstanding Paid-In Capital in Excess of Par Retained Earnings Total Stockholders' Equity Total Liabilities and Stockholders' Equity 250,000 150,000 400,000 1,306,000 150,000 175,000 325,000 1,301,273 225,000 225,000 58,000 58,000 581,000 474,727 864,000 757,727 $ 2,170,000 $2,059,000 Requirement Perform a vertical analysis on the balance sheet and income statement for 2023. Complete the grey boxes below. ORANGE UNIVERSE Comparative Balance Sheet June 30, 2023 ORANGE UNIVERSE Income Statement Year Ended June 30, 2023 Assets $ 2,800,000 1,551,600 1,248,400 450,540 797,860 $ Current Assets: Cash Short-term Investments Accounts Receivable Merchandise Inventory Other Current Assets Total Current Assets Property, Plant, and Equipment Total Assets 138,000 675,000 230,000 63,000 189,000 1,295,000 875,000 2,170,000 Net Sales Cost of Goods Sold Gross Profit Operating Expenses Operating Income Other Income and (Expenses) Interest Expense Income Before Income Taxes Income Tax Expense Net Income (15,000) 782,860 153,529 629,331 $ $ 265,000 641,000 906,000 Liabilities Current Liabilities: Accounts Payable Accrued Liabilities Total Current Liabilities Long-term Liabilities Bonds Payable Mortgage Payable Total Long-term Liabilities Total Liabilities Stockholders' Equity Common Stock, $1 par, 225,000 shares issued and outstanding Paid-In Capital in Excess of Par Retained Earnings Total Stockholders' Equity Total Liabilities and Stockholders' Equity 250,000 150,000 400,000 1,306,000 225,000 58,000 581,000 864,000 2,170,000 $ Requirement 3 Compute the following ratios in the grey cells: 2023 2022 Working Capital Current Ratio Acid-Test (Quick) Ratio Cash Ratio Accounts Receivable Turnover Days' Sales in Receivables Inventory Turnover Days' Sales in Inventory Gross Profit Percentage Debt Ratio Debt to Equity Ratio Times-Interest-Earned Ratio Profit Margin Ratio Rate of Return on Total Assets Asset Turnover Ratio Rate of Return on Common Stockholders' Equity Earnings per Share (EPS) Price/Earnings Ratio Dividend Yield Dividend Payout
Step by Step Solution
There are 3 Steps involved in it

Get step-by-step solutions from verified subject matter experts