

Question: Is this right? The boxplots shown below represent customer waiting times (minutes) for two different waiting lines. Which line would you prefer, or does it
Is this right?
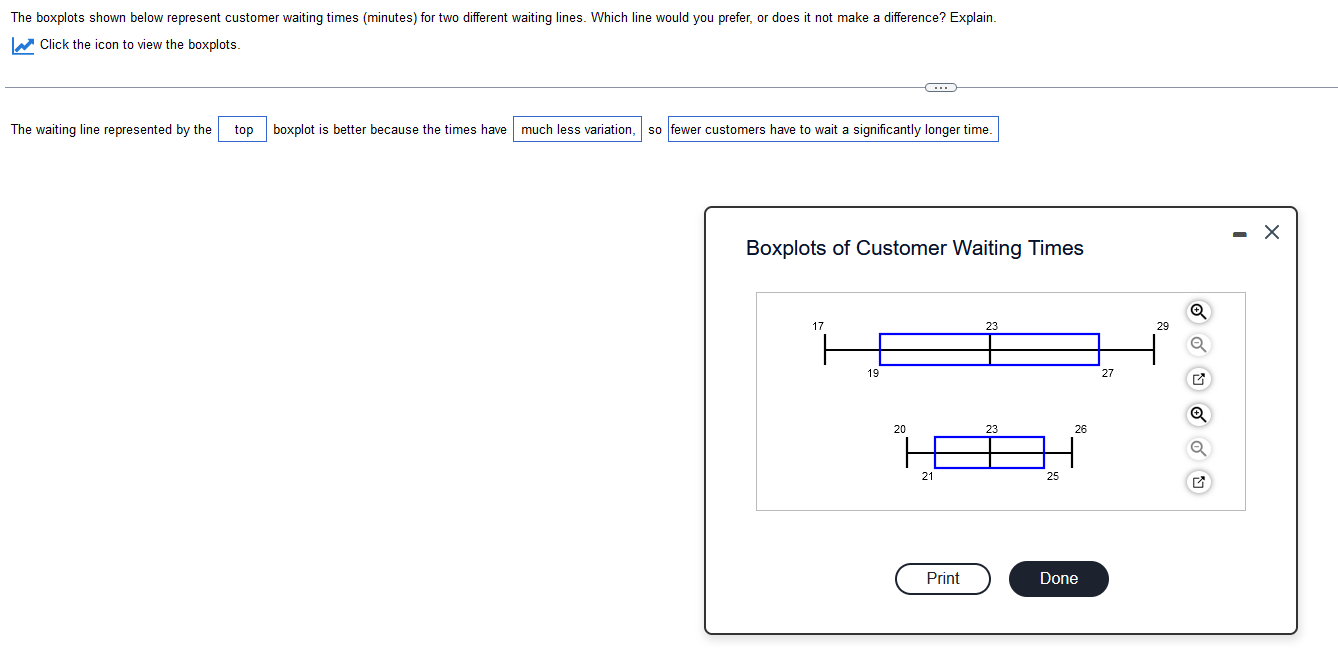
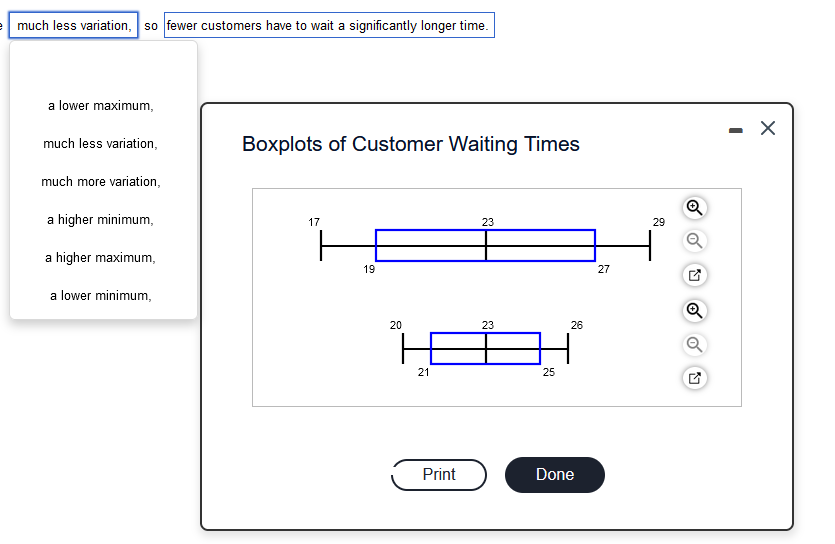
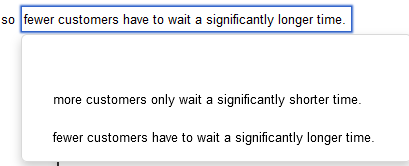
The boxplots shown below represent customer waiting times (minutes) for two different waiting lines. Which line would you prefer, or does it not make a difference? Explain. Click the icon to view the boxplots. The waiting line represented by the top boxplot is better because the times have much less variation, so fewer customers have to wait a significantly longer time. Boxplots of Customer Waiting Times - X 17 23 19 27 20 23 26 21 25 Print Donemuch less variation, so fewer customers have to wait a significantly longer time. a lower maximum, - X much less variation, Boxplots of Customer Waiting Times much more variation, a higher minimum, 17 23 29 a higher maximum, 19 27 a lower minimum, 20 23 26 21 25 Print DoneSO fewer customers have to wait a significantly longer time. more customers only wait a significantly shorter time. fewer customers have to wait a significantly longer time
Step by Step Solution
There are 3 Steps involved in it

Get step-by-step solutions from verified subject matter experts