

Question: The boxplots shown below represent customer waiting times (minutes) for two different waiting lines. Which line would you prefer, or does it not make a
The boxplots shown below represent customer waiting times (minutes) for two different waiting lines. Which line would you prefer, or does it not make a difference? Explain.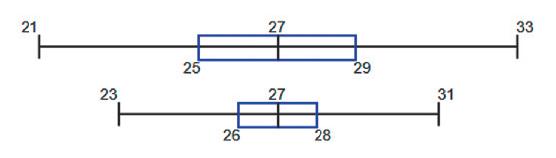
21 23 25 26 27 27 28 29 31 33
Step by Step Solution
★★★★★
3.37 Rating (169 Votes )
There are 3 Steps involved in it
1 Expert Approved Answer
Step: 1 Unlock

The waiting line represented by ... View full answer
Question Has Been Solved by an Expert!
Get step-by-step solutions from verified subject matter experts
Step: 2 Unlock
Step: 3 Unlock