

Question: is this right? The graph on the right shows the market for hamburger, which is in equilibrium. Hamburger is a normal good, and people like
is this right?
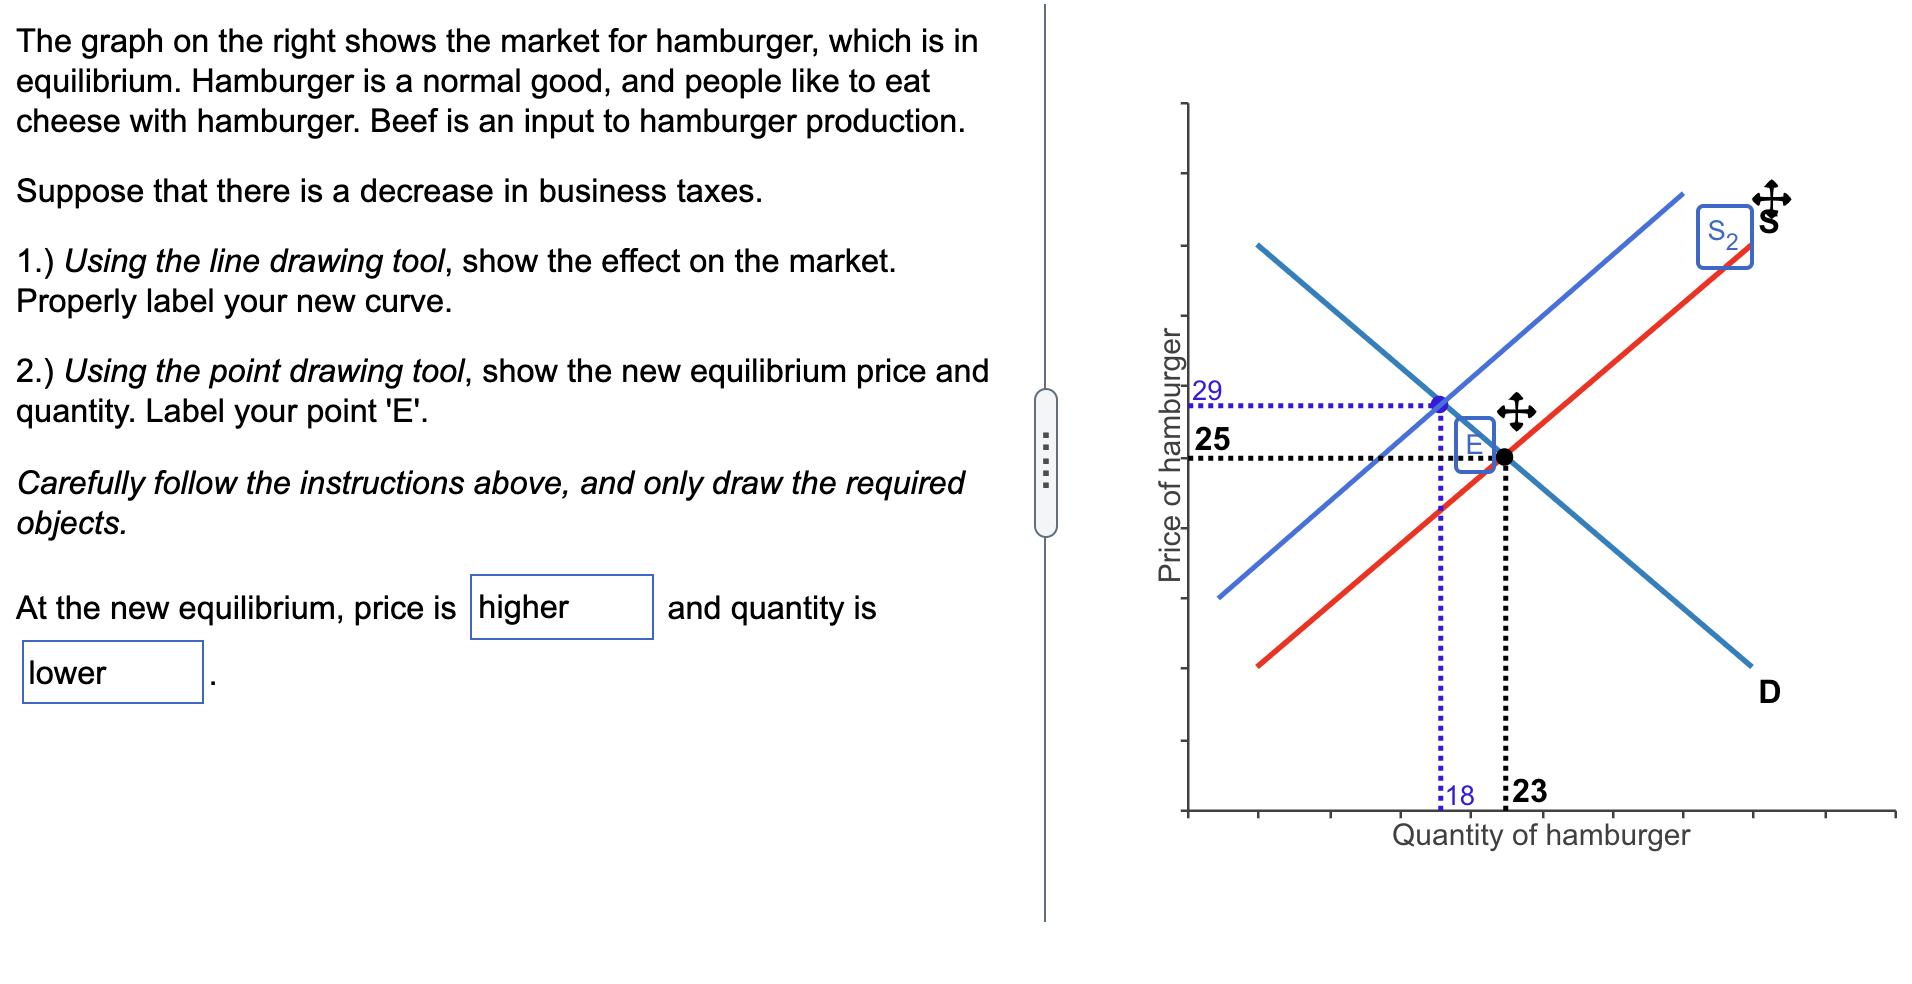
The graph on the right shows the market for hamburger, which is in equilibrium. Hamburger is a normal good, and people like to eat cheese with hamburger. Beef is an input to hamburger production. Suppose that there is a decrease in business taxes. 1.) Using the line drawing tool, show the effect on the market. Properly label your new curve. 2.) Using the point drawing tool, show the new equilibrium price and quantity. Label your point 'E'. Carefully follow the instructions above, and only draw the required objects. At the new equilibrium, price is and quantity is lower . E Price of he Quantity of hamburger
Step by Step Solution
There are 3 Steps involved in it
1 Expert Approved Answer
Step: 1 Unlock

Question Has Been Solved by an Expert!
Get step-by-step solutions from verified subject matter experts
Step: 2 Unlock
Step: 3 Unlock