

Question: IS310 Second Assignment Refer to the traffic congestion cost table as the primary source of your observations, and do the followings; ONLY TYPED COPY
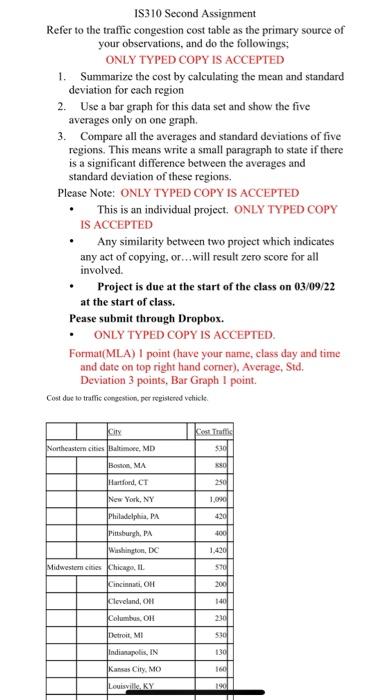
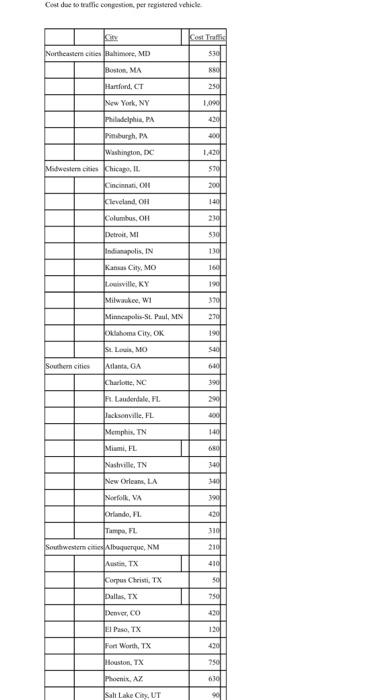
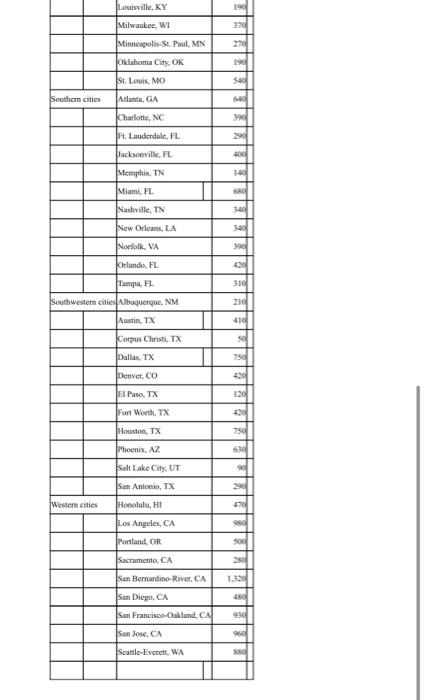
IS310 Second Assignment Refer to the traffic congestion cost table as the primary source of your observations, and do the followings; ONLY TYPED COPY IS ACCEPTED 1. Summarize the cost by calculating the mean and standard deviation for each region 2. Use a bar graph for this data set and show the five averages only on one graph. 3. Compare all the averages and standard deviations of five regions. This means write a small paragraph to state if there is a significant difference between the averages and standard deviation of these regions. Please Note: ONLY TYPED COPY IS ACCEPTED This is an individual project. ONLY TYPED COPY IS ACCEPTED Any similarity between two project which indicates any act of copying, or...will result zero score for all involved. Project is due at the start of the class on 03/09/22 at the start of class. Pease submit through Dropbox. ONLY TYPED COPY IS ACCEPTED. Format(MLA) I point (have your name, class day and time and date on top right hand corner). Average, Std. Deviation 3 points, Bar Graph I point. Cost due to traffic congestion, per registered vehicle. City Cost Traffic Northeaster cities Baltimore, MD Boston, MA $30 880 Hartford, CT 250 New York, NY 1,090 Philadelphia, PA 420 Pittsburgh, PA 400 Washington, DC 1,420 Midwestem cities Chicago, IL. 570 Cincinnati, OH 200 Cleveland, OH 140 Columbus, OH 230 Detroit, MI 530 Indianapolis, IN 130 Kansas City, MO 160 Louisville, KY 190
Step by Step Solution
There are 3 Steps involved in it

Get step-by-step solutions from verified subject matter experts