

Question: ist = Homework: W... Question 6, 22.12 Homework: Part 1 of 2 The table below shows the frequency distribution of the rainfall on 52 consecutive
ist = Homework: W...
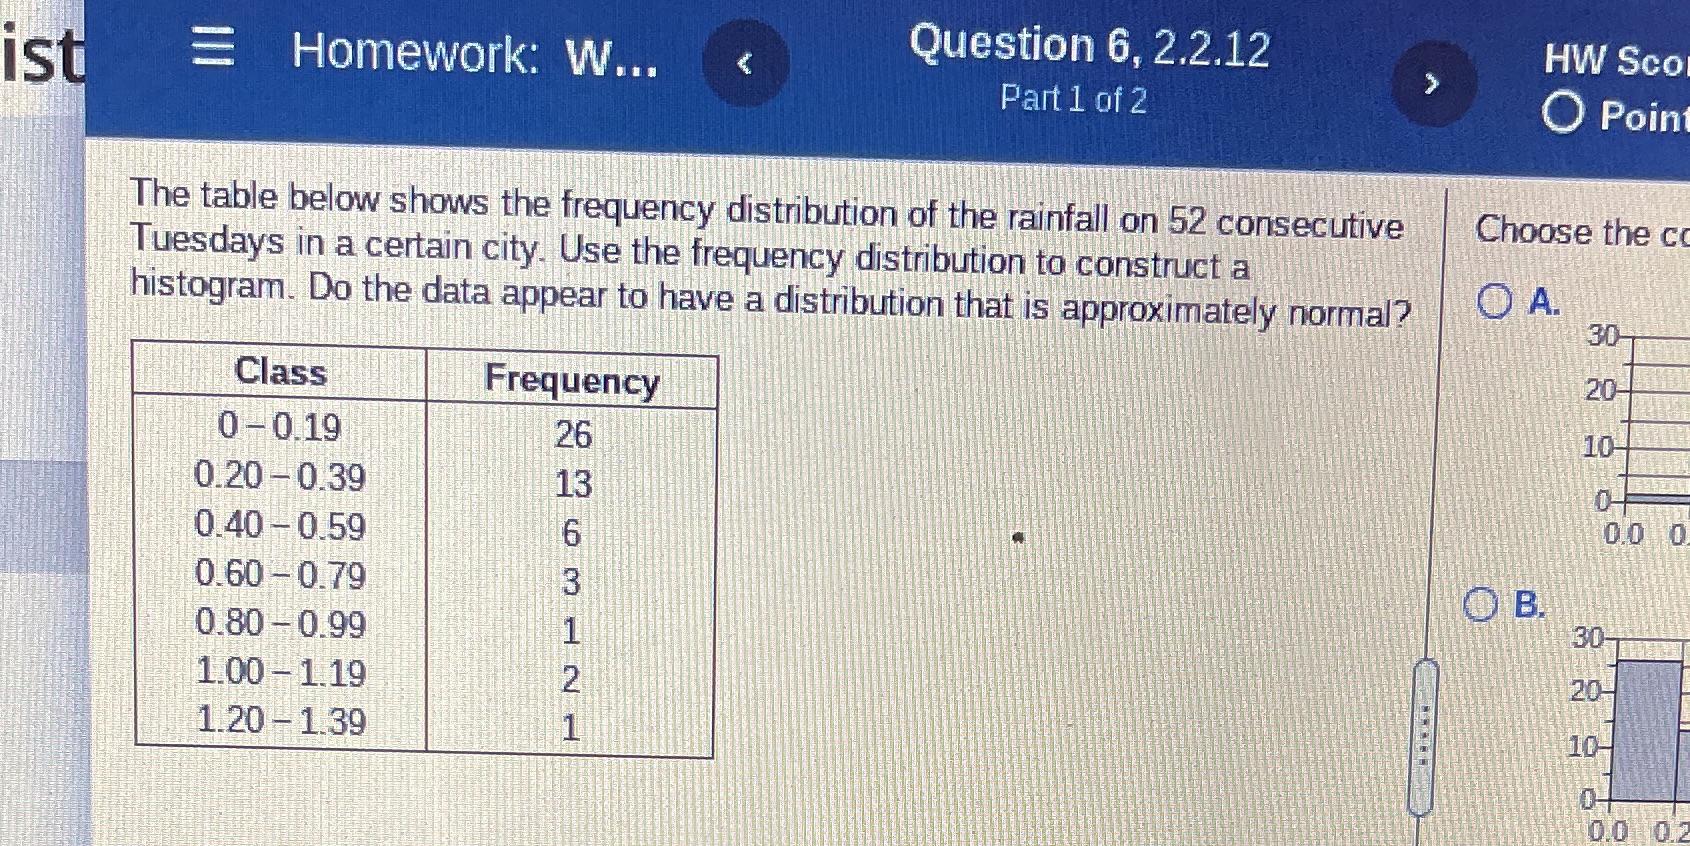
Question 6, 22.12 Homework: Part 1 of 2 The table below shows the frequency distribution of the rainfall on 52 consecutive Tuesdays in a certain city. Use the frequency distribution to construct a histogram. Do the data appear to have a distribution that is approximately normaP 0.20-039 0.40-059 0.60-079 0.80-099 1.00-119 1.20-139 Class 0-0.19 Frequency 26 13 HW sco O Poin Choose the c 0.0 0,
Step by Step Solution
There are 3 Steps involved in it
1 Expert Approved Answer
Step: 1 Unlock

Question Has Been Solved by an Expert!
Get step-by-step solutions from verified subject matter experts
Step: 2 Unlock
Step: 3 Unlock