

Question: It asks for: 1. Set up excel sheet that incudes the balance sheet, Income Statement and Cash Flow Stateme nt from Exhibit 4.29 2. Make
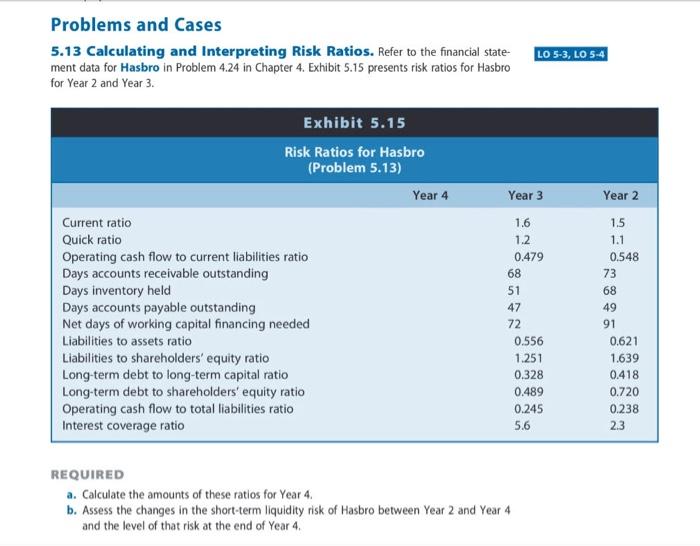
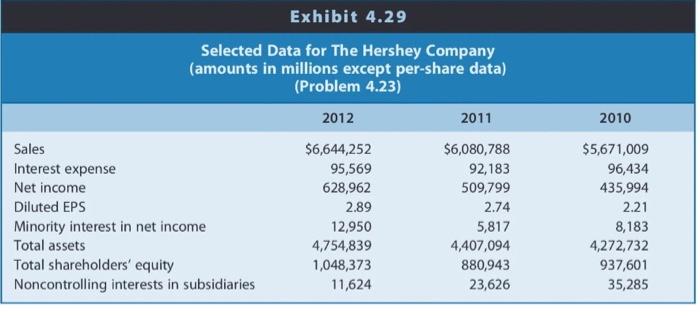
Assignment Content Answer the questions posed for problem 5.13 on pages 385 and 386. Please submit your answers only on a Word document. No, PDFs. For part a, it is suggested that you set up an excel spreadsheet that includes the Balance Sheet, Income Statement and Cash Flow Statement from problem 4.24 on pages 306 and 307. Then, make sure you have the correct formulas to get the same numbers as are presented for Year 2 and Year 3. Year 4 should then be a simple case of moving the formulas over. Problems and Cases 5.13 Calculating and Interpreting Risk Ratios. Refer to the financial state- ment data for Hasbro in Problem 4.24 in Chapter 4. Exhibit 5.15 presents risk ratios for Hasbro for Year 2 and Year 3. Exhibit 5.15 Risk Ratios for Hasbro (Problem 5.13) Year 3 Current ratio 1.6 Quick ratio 1.2 Operating cash flow to current liabilities ratio 0.479 Days accounts receivable outstanding Days inventory held Days accounts payable outstanding Net days of working capital financing needed Liabilities to assets ratio 0.556 1.251 0.328 Liabilities to shareholders' equity ratio Long-term debt to long-term capital ratio Long-term debt to shareholders' equity ratio Operating cash flow to total liabilities ratio Interest coverage ratio 0.489 0.245 5.6 REQUIRED a. Calculate the amounts of these ratios for Year 4. b. Assess the changes in the short-term liquidity risk of Hasbro between Year 2 and Year 4 and the level of that risk at the end of Year 4. Year 4 68 51 47 72 LO 5-3, LO 5-4 Year 2 1.5 1.1 0.548 73 68 49 91 0.621 1.639 0.418 0.720 0.238 2.3 Exhibit 4.29 Selected Data for The Hershey Company (amounts in millions except per-share data) (Problem 4.23) 2012 2011 $6,644,252 $6,080,788 95,569 92,183 628,962 509,799 2.89 2.74 12,950 5,817 4,754,839 4,407,094 1,048,373 880,943 11,624 23,626 Sales Interest expense Net income Diluted EPS Minority interest in net income Total assets Total shareholders' equity Noncontrolling interests in subsidiaries 2010 $5,671,009 96,434 435,994 2.21 8,183 4,272,732 937,601 35,285 Assignment Content Answer the questions posed for problem 5.13 on pages 385 and 386. Please submit your answers only on a Word document. No, PDFs. For part a, it is suggested that you set up an excel spreadsheet that includes the Balance Sheet, Income Statement and Cash Flow Statement from problem 4.24 on pages 306 and 307. Then, make sure you have the correct formulas to get the same numbers as are presented for Year 2 and Year 3. Year 4 should then be a simple case of moving the formulas over. Problems and Cases 5.13 Calculating and Interpreting Risk Ratios. Refer to the financial state- ment data for Hasbro in Problem 4.24 in Chapter 4. Exhibit 5.15 presents risk ratios for Hasbro for Year 2 and Year 3. Exhibit 5.15 Risk Ratios for Hasbro (Problem 5.13) Year 3 Current ratio 1.6 Quick ratio 1.2 Operating cash flow to current liabilities ratio 0.479 Days accounts receivable outstanding Days inventory held Days accounts payable outstanding Net days of working capital financing needed Liabilities to assets ratio 0.556 1.251 0.328 Liabilities to shareholders' equity ratio Long-term debt to long-term capital ratio Long-term debt to shareholders' equity ratio Operating cash flow to total liabilities ratio Interest coverage ratio 0.489 0.245 5.6 REQUIRED a. Calculate the amounts of these ratios for Year 4. b. Assess the changes in the short-term liquidity risk of Hasbro between Year 2 and Year 4 and the level of that risk at the end of Year 4. Year 4 68 51 47 72 LO 5-3, LO 5-4 Year 2 1.5 1.1 0.548 73 68 49 91 0.621 1.639 0.418 0.720 0.238 2.3 Exhibit 4.29 Selected Data for The Hershey Company (amounts in millions except per-share data) (Problem 4.23) 2012 2011 $6,644,252 $6,080,788 95,569 92,183 628,962 509,799 2.89 2.74 12,950 5,817 4,754,839 4,407,094 1,048,373 880,943 11,624 23,626 Sales Interest expense Net income Diluted EPS Minority interest in net income Total assets Total shareholders' equity Noncontrolling interests in subsidiaries 2010 $5,671,009 96,434 435,994 2.21 8,183 4,272,732 937,601 35,285
Step by Step Solution
There are 3 Steps involved in it

Get step-by-step solutions from verified subject matter experts