

Question: it. Create a spreadsheet like the one shown below. The spreadsheet should use the returns for assets A and B to form a portfolio return
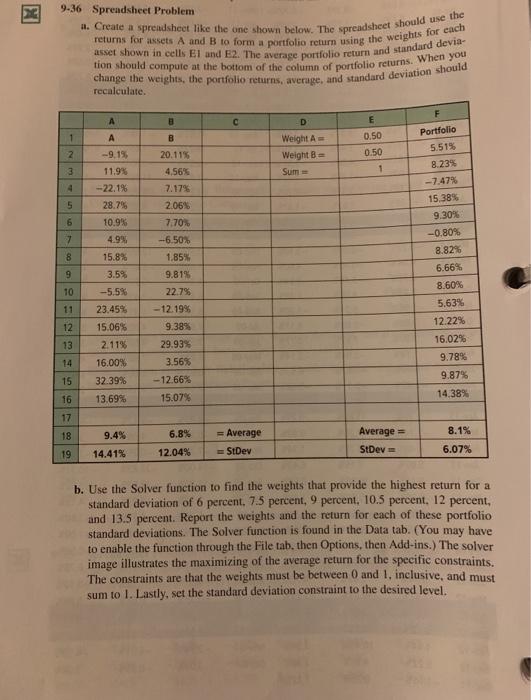
it. Create a spreadsheet like the one shown below. The spreadsheet should use the returns for assets A and B to form a portfolio return using the weights for each asset shown in cells El and E2. The average portfolio return and standard devia- tion should compute at the bottom of the column of portfolio returns. When you change the weights, the portfolio returns, average, and standard deviation should 9-36 Spreadsheet Problem recalculate. F A 3 D E 1 A B 2 Weight Weight = Sum 0.50 0.50 1 3 Portfolio 5.51% 8.23% -- 7.47% 15,38% 9 30% -9.15, 11.9% -22.1% 28.7% 10.9% 4.9% 4 5 6 7 20.11% 4,56% 7.17% 2.06% 7.70 -6.50% 1.85% 9.815 22.75 - 12.1995 9.38% 29.93% 8 9 10 -0.80% 8.82% 6.66% 8.60% 5.63% 12.22% 16.02% 9.78% 9.87% 11 15.8% 3.5% -5.5% 23.45% 15.06% 2.11% 16.00% 32.39% 13.69% 12 13 14 15 3.56% -12.66% 15.07% 14,38% 16 17 18 9.4% 8.1% 6.8% 12.04% = Average StDev Average = StDev 19 14.41% 6.07% b. Use the Solver function to find the weights that provide the highest return for a standard deviation of 6 percent. 7.5 percent, 9 percent, 10.5 percent. 12 percent, and 13.5 percent. Report the weights and the return for each of these portfolio standard deviations. The Solver function is found in the Data tab. (You may have to enable the function through the File tab. then Options, then Add-ins.) The solver image illustrates the maximizing of the average return for the specific constraints. The constraints are that the weights must be between 0 and 1, inclusive, and must sum to 1. Lastly, set the standard deviation constraint to the desired level
Step by Step Solution
There are 3 Steps involved in it

Get step-by-step solutions from verified subject matter experts