

Question: It has to be in matlab. Plot the function x10for 4 S s 9. Notice that the finction x2-3x-10 asymptotes. Plot the function by dividing
It has to be in matlab.
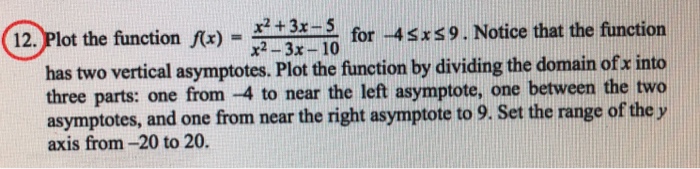
Plot the function x10for 4 S s 9. Notice that the finction x2-3x-10 asymptotes. Plot the function by dividing the domain ofx into has two vertical three parts: one from -4 to near the left asymptote, one between the two asymptotes, and one from near the right asymptote to 9. Set the range of they axis from -20 to 20
Step by Step Solution
There are 3 Steps involved in it
1 Expert Approved Answer
Step: 1 Unlock

Question Has Been Solved by an Expert!
Get step-by-step solutions from verified subject matter experts
Step: 2 Unlock
Step: 3 Unlock