

Question: It is given as AND a) Draw or Plot (Whatever Word) X(w) and Y(w). b) The y(t) signal is applied to the input of an
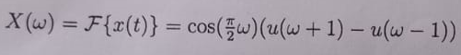
It is given as
 AND
AND
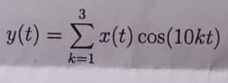
a) Draw or Plot(Whatever Word) X(w) and Y(w).
b) The y(t) signal is applied to the input of an ideal bandpass filter (BPF) with a lower cutoff frequency w1 = 10[rad/s] and an upper cutoff frequency w2 = 20[rad/s]. Plot the frequency spectrum of the signal at the filter output.
*** THIS IS SIGNAL AND SYSTEMS ***
I would appreciate it if you could solve each process by explaining. If true, I will like it.
X(w) = F{r(t)} = cos("w)(u(w +1) uw - 1)) = = ) 3 y(t) =
Step by Step Solution
There are 3 Steps involved in it
1 Expert Approved Answer
Step: 1 Unlock

Question Has Been Solved by an Expert!
Get step-by-step solutions from verified subject matter experts
Step: 2 Unlock
Step: 3 Unlock