Question: It is SUPPLY CHAIN QUESTION. it snot imcomplete . all data is given 1. The liner shipping company wants to optimize its inland transports. You
It is SUPPLY CHAIN QUESTION. it snot imcomplete . all data is given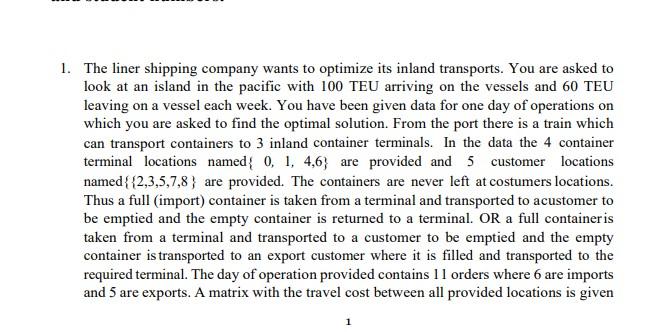
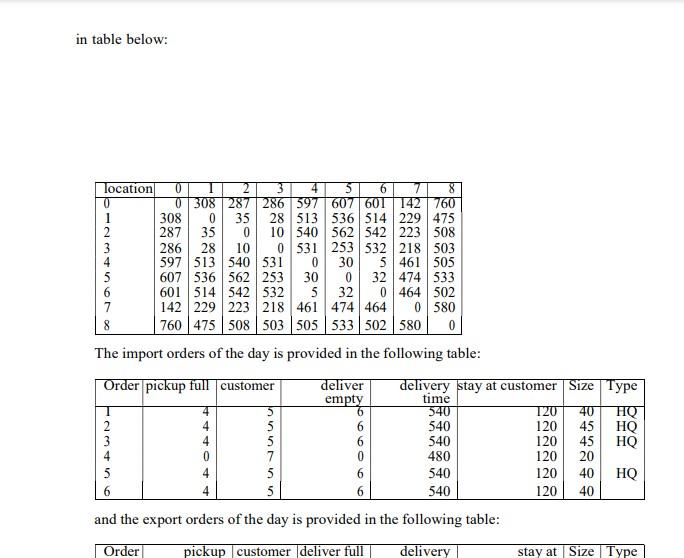
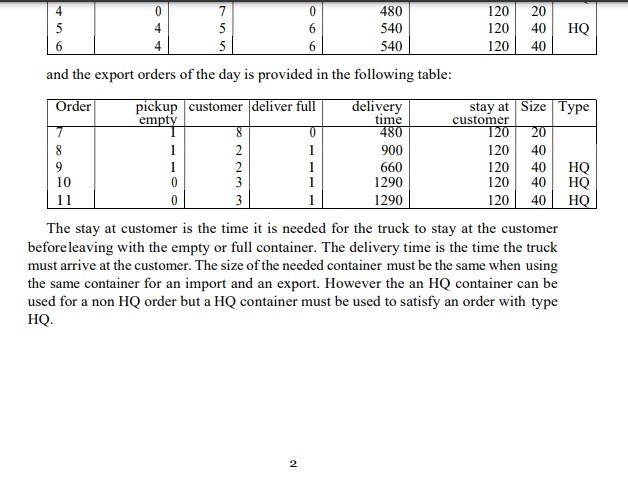
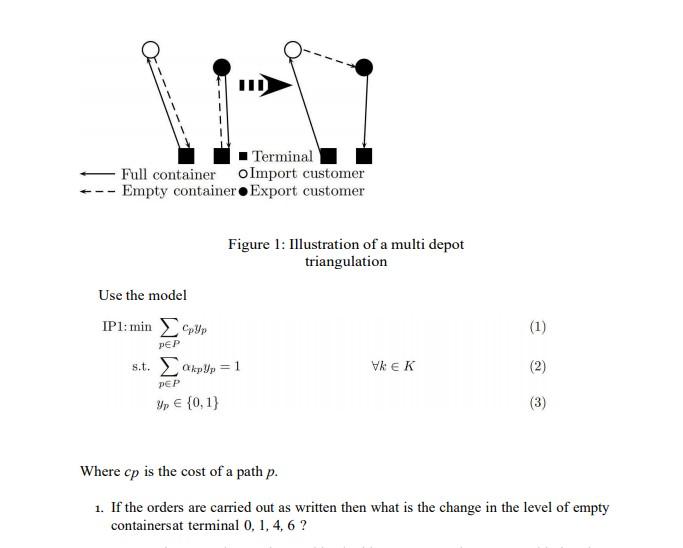
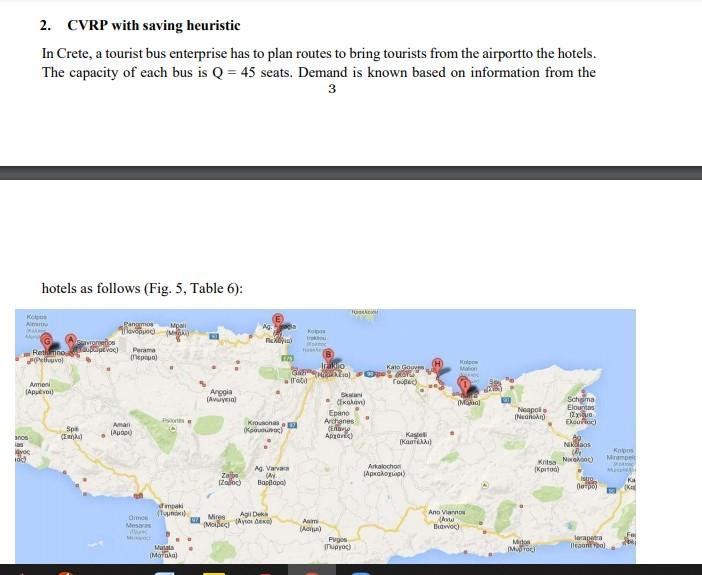
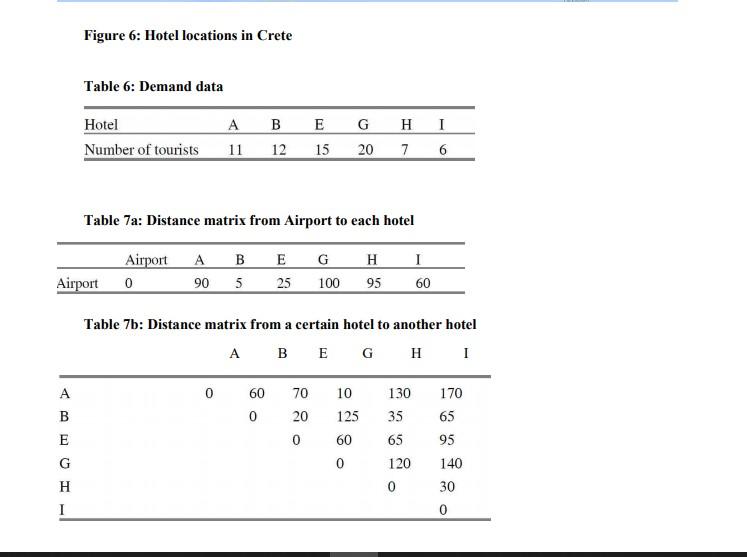
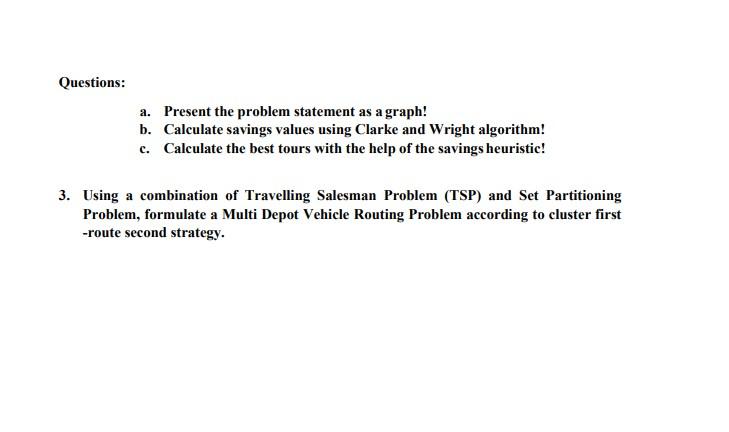
1. The liner shipping company wants to optimize its inland transports. You are asked to look at an island in the pacific with 100 TEU arriving on the vessels and 60 TEU leaving on a vessel each week. You have been given data for one day of operations on which you are asked to find the optimal solution. From the port there is a train which can transport containers to 3 inland container terminals. In the data the 4 container terminal locations named{ 0, 1, 4,6) are provided and 5 customer locations named{{2,3,5,7,8) are provided. The containers are never left at costumers locations. Thus a full (import) container is taken from a terminal and transported to acustomer to be emptied and the empty container is returned to a terminal. OR a full containeris taken from a terminal and transported to a customer to be emptied and the empty container is transported to an export customer where it is filled and transported to the required terminal. The day of operation provided contains 11 orders where 6 are imports and 5 are exports. A matrix with the travel cost between all provided locations is given in table below: location 0 4 5 6 8 0 0308 287 286 597 607 601 142 760 1 308 0 35 28 513 536 514 229 475 2 287 35 0 10 540 562 542 223 508 286 28 10 0 531 253 532 218 503 597 513 540 531 0 30 5461 505 607 536 562 253 30 0 32 474 533 601 514 542 532 5 32 0 464 502 142 229 223 218 461 474 464 0 580 8 760 475 508 503 505 533 502 580 0 4 4 6 6 HQ The import orders of the day is provided in the following table: Order pickup full customer deliver delivery stay at customer Size Type empty time 540 120 40 HQ 2 540 120 45 540 120 45 HQ 480 120 20 5 4 540 120 40 HQ 6 4 540 120 40 and the export orders of the day is provided in the following table: Order pickup customer deliver full delivery stay at Size Type UAN uuuuu 6 6 OOO 4 0 7 0 480 120 20 5 4 5 6 540 120 40 HQ 6 5 6 540 120 40 and the export orders of the day is provided in the following table: Order pickup customer deliver full delivery stay at Size Type empty time customer 0 480 120 20 8 1 2 1 900 120 40 1 2 1 660 120 40 10 0 3 1 1290 120 40 HQ 11 0 3 1 1290 120 HQ The stay at customer is the time it is needed for the truck to stay at the customer before leaving with the empty or full container. The delivery time is the time the truck must arrive at the customer. The size of the needed container must be the same when using the same container for an import and an export. However the an HQ container can be used for a non HQ order but a HQ container must be used to satisfy an order with type HQ. 9 UNN HQ 40 2 Terminal - Full container o Import customer Empty container Export customer Figure 1: Illustration of a multi depot triangulation Use the model IPI: min s.t. OkpWp = 1 WEK (1) PEP (2) PEP Yp {0,1) (3) Where cp is the cost of a path p. 1. If the orders are carried out as written then what is the change in the level of empty containersat terminal 0, 1, 4, 6 ? Where cp is the cost of a path p. 1. If the orders are carried out as written then what is the change in the level of empty containersat terminal 0, 1, 4, 6 ? 2. Now an import order can be combined with an export order. Not considering time (assuming delivery time can be any time) but only container size and type what are the possible combinations ? Note that a HQ can be used for a non HQ export of the same size 3. What is the total number of possible routes and what is the total number of possible routeswhen considering container size and type? 4. Find the cost of each route. 5. Make a model as shown above for the routes so that all containers are delivered? 6. Use excel solver to find the solution. 7. What is the difference in container levels at terminals at the end of the day when using theresults from excel solver. 2. CVRP with saving heuristic In Crete, a tourist bus enterprise has to plan routes to bring tourists from the airportto the hotels. The capacity of each bus is Q = 45 seats. Demand is known based on information from the 3 2. CVRP with saving heuristic In Crete, a tourist bus enterprise has to plan routes to bring tourists from the airportto the hotels. The capacity of each bus is Q = 45 seats. Demand is known based on information from the 3 hotels as follows (Fig. 5, Table 6): Mpal MAS No Am Pancemos Svoritos Relho de vol Parama POP Vol pl neko M wo rio re Kata Gom Amon ) Aggia Ayia IM! ( CIKORT) Epano Ardones GE ) ) Neapol INcaan Schisma Elounts 2x Four Spe () Aman ( K. Koulun nos Kastel () 100 Mrum Ag. Varva Bandopal Arkachos [) Niklas kitsa N000 () ) Istre Zalbe Zaloc) K ke dimai Dimo Mesa AD Mire Am ( Ano ang Chow ) Fe Pugos ) Malta () larapatra Deportal Me Mudroc) Figure 6: Hotel locations in Crete Table 6: Demand data G H I Hotel Number of tourists 11 BE 12 15 20 7 6 Table 7a: Distance matrix from Airport to each hotel G Airport 0 B 90 5 E 25 H 95 I 60 Airport 100 Table 7b: Distance matrix from a certain hotel to another hotel A B E G H 1 0 60 10 170 70 20 130 35 0 125 60 0 A B E G H I 65 95 140 65 120 0 0 30 0 Questions: a. Present the problem statement as a graph! b. Calculate savings values using Clarke and Wright algorithm! c. Calculate the best tours with the help of the savings heuristic! 3. Using a combination of Travelling Salesman Problem (TSP) and Set Partitioning Problem, formulate a Multi Depot Vehicle Routing Problem according to cluster first -route second strategy. 1. The liner shipping company wants to optimize its inland transports. You are asked to look at an island in the pacific with 100 TEU arriving on the vessels and 60 TEU leaving on a vessel each week. You have been given data for one day of operations on which you are asked to find the optimal solution. From the port there is a train which can transport containers to 3 inland container terminals. In the data the 4 container terminal locations named{ 0, 1, 4,6) are provided and 5 customer locations named{{2,3,5,7,8) are provided. The containers are never left at costumers locations. Thus a full (import) container is taken from a terminal and transported to acustomer to be emptied and the empty container is returned to a terminal. OR a full containeris taken from a terminal and transported to a customer to be emptied and the empty container is transported to an export customer where it is filled and transported to the required terminal. The day of operation provided contains 11 orders where 6 are imports and 5 are exports. A matrix with the travel cost between all provided locations is given in table below: location 0 4 5 6 8 0 0308 287 286 597 607 601 142 760 1 308 0 35 28 513 536 514 229 475 2 287 35 0 10 540 562 542 223 508 286 28 10 0 531 253 532 218 503 597 513 540 531 0 30 5461 505 607 536 562 253 30 0 32 474 533 601 514 542 532 5 32 0 464 502 142 229 223 218 461 474 464 0 580 8 760 475 508 503 505 533 502 580 0 4 4 6 6 HQ The import orders of the day is provided in the following table: Order pickup full customer deliver delivery stay at customer Size Type empty time 540 120 40 HQ 2 540 120 45 540 120 45 HQ 480 120 20 5 4 540 120 40 HQ 6 4 540 120 40 and the export orders of the day is provided in the following table: Order pickup customer deliver full delivery stay at Size Type UAN uuuuu 6 6 OOO 4 0 7 0 480 120 20 5 4 5 6 540 120 40 HQ 6 5 6 540 120 40 and the export orders of the day is provided in the following table: Order pickup customer deliver full delivery stay at Size Type empty time customer 0 480 120 20 8 1 2 1 900 120 40 1 2 1 660 120 40 10 0 3 1 1290 120 40 HQ 11 0 3 1 1290 120 HQ The stay at customer is the time it is needed for the truck to stay at the customer before leaving with the empty or full container. The delivery time is the time the truck must arrive at the customer. The size of the needed container must be the same when using the same container for an import and an export. However the an HQ container can be used for a non HQ order but a HQ container must be used to satisfy an order with type HQ. 9 UNN HQ 40 2 Terminal - Full container o Import customer Empty container Export customer Figure 1: Illustration of a multi depot triangulation Use the model IPI: min s.t. OkpWp = 1 WEK (1) PEP (2) PEP Yp {0,1) (3) Where cp is the cost of a path p. 1. If the orders are carried out as written then what is the change in the level of empty containersat terminal 0, 1, 4, 6 ? Where cp is the cost of a path p. 1. If the orders are carried out as written then what is the change in the level of empty containersat terminal 0, 1, 4, 6 ? 2. Now an import order can be combined with an export order. Not considering time (assuming delivery time can be any time) but only container size and type what are the possible combinations ? Note that a HQ can be used for a non HQ export of the same size 3. What is the total number of possible routes and what is the total number of possible routeswhen considering container size and type? 4. Find the cost of each route. 5. Make a model as shown above for the routes so that all containers are delivered? 6. Use excel solver to find the solution. 7. What is the difference in container levels at terminals at the end of the day when using theresults from excel solver. 2. CVRP with saving heuristic In Crete, a tourist bus enterprise has to plan routes to bring tourists from the airportto the hotels. The capacity of each bus is Q = 45 seats. Demand is known based on information from the 3 2. CVRP with saving heuristic In Crete, a tourist bus enterprise has to plan routes to bring tourists from the airportto the hotels. The capacity of each bus is Q = 45 seats. Demand is known based on information from the 3 hotels as follows (Fig. 5, Table 6): Mpal MAS No Am Pancemos Svoritos Relho de vol Parama POP Vol pl neko M wo rio re Kata Gom Amon ) Aggia Ayia IM! ( CIKORT) Epano Ardones GE ) ) Neapol INcaan Schisma Elounts 2x Four Spe () Aman ( K. Koulun nos Kastel () 100 Mrum Ag. Varva Bandopal Arkachos [) Niklas kitsa N000 () ) Istre Zalbe Zaloc) K ke dimai Dimo Mesa AD Mire Am ( Ano ang Chow ) Fe Pugos ) Malta () larapatra Deportal Me Mudroc) Figure 6: Hotel locations in Crete Table 6: Demand data G H I Hotel Number of tourists 11 BE 12 15 20 7 6 Table 7a: Distance matrix from Airport to each hotel G Airport 0 B 90 5 E 25 H 95 I 60 Airport 100 Table 7b: Distance matrix from a certain hotel to another hotel A B E G H 1 0 60 10 170 70 20 130 35 0 125 60 0 A B E G H I 65 95 140 65 120 0 0 30 0 Questions: a. Present the problem statement as a graph! b. Calculate savings values using Clarke and Wright algorithm! c. Calculate the best tours with the help of the savings heuristic! 3. Using a combination of Travelling Salesman Problem (TSP) and Set Partitioning Problem, formulate a Multi Depot Vehicle Routing Problem according to cluster first -route second strategy


