

Question: Items Total Unit Sold (Units) Price per unit (RM) Total Fixed Cost (RM) Total Variable Cost (RM) Targeted Profit (RM) TABLE 2 Product X Product
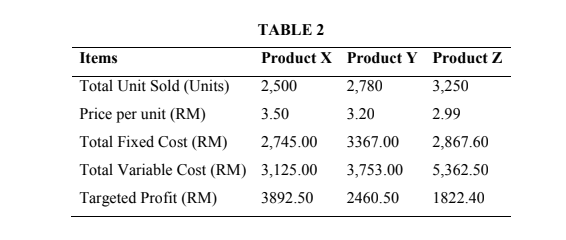
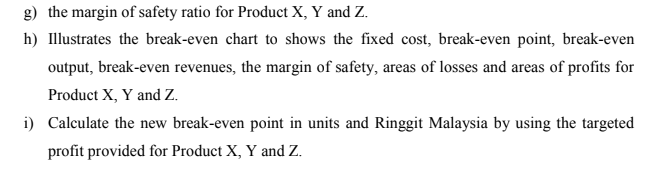
Items Total Unit Sold (Units) Price per unit (RM) Total Fixed Cost (RM) Total Variable Cost (RM) Targeted Profit (RM) TABLE 2 Product X Product Y Product Z 2,500 2,780 3,250 3.50 3.20 2.99 2,745.00 3367.00 2,867.60 3,125.00 3,753.00 5,362.50 3892.50 2460.50 1822.40 g) the margin of safety ratio for Product X, Y and Z. h) Illustrates the break-even chart to shows the fixed cost, break-even point, break-even output, break-even revenues, the margin of safety, areas of losses and areas of profits for Product X, Y and Z. i) Calculate the new break-even point in units and Ringgit Malaysia by using the targeted profit provided for Product X, Y and Z
Step by Step Solution
There are 3 Steps involved in it
1 Expert Approved Answer
Step: 1 Unlock

Question Has Been Solved by an Expert!
Get step-by-step solutions from verified subject matter experts
Step: 2 Unlock
Step: 3 Unlock