

Question: ities and labels on every graph and table., Use this information for problems 1 - 3: Dr. Baggs decided to look at the receipts from
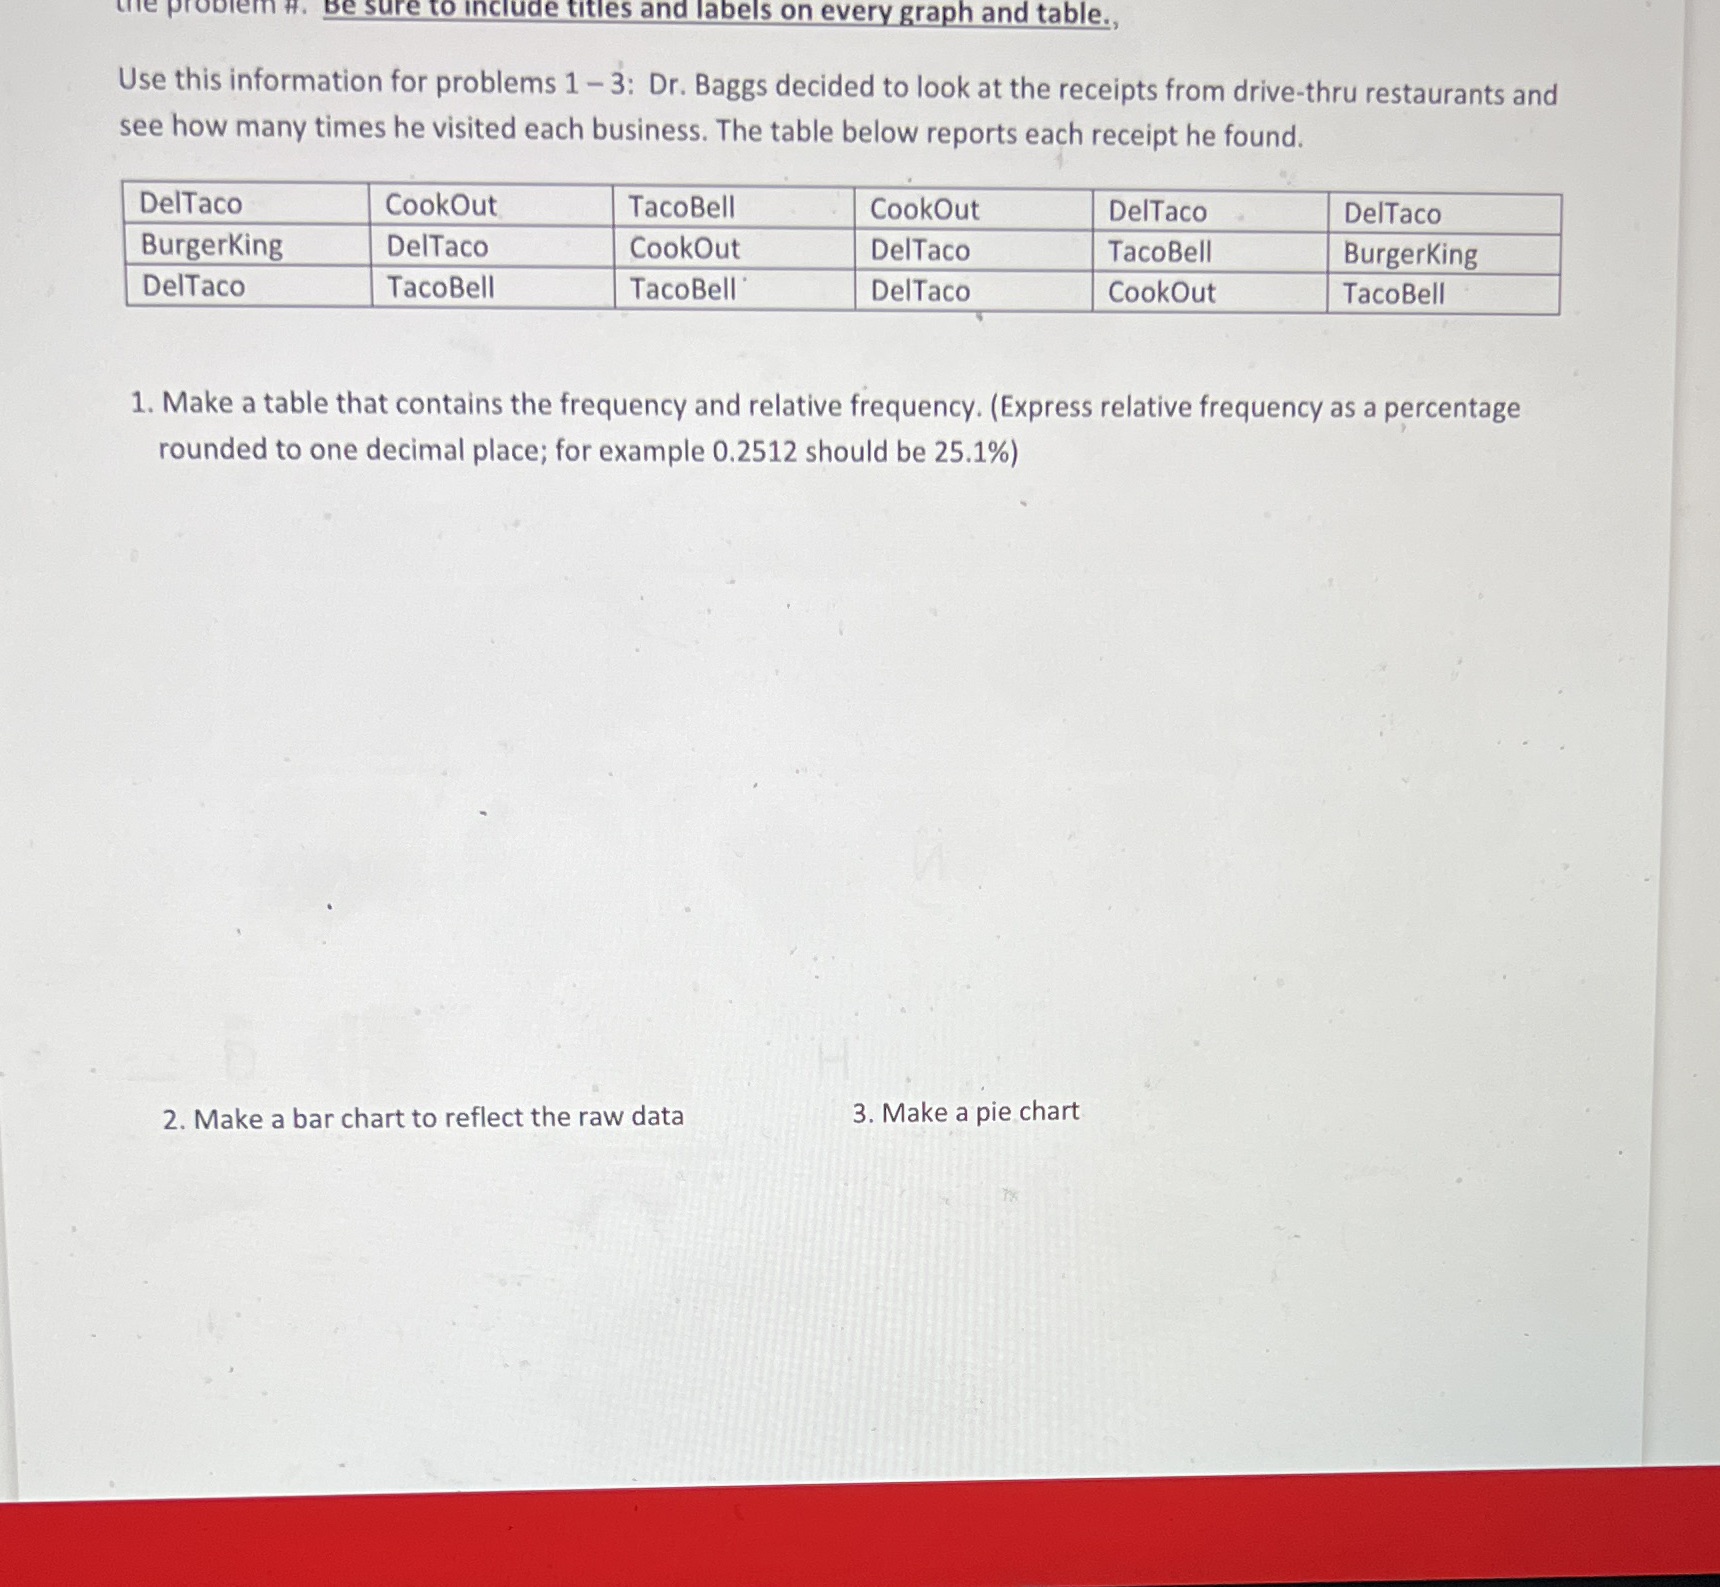

ities and labels on every graph and table., Use this information for problems 1 - 3: Dr. Baggs decided to look at the receipts from drive-thru restaurants and see how many times he visited each business. The table below reports each receipt he found. DelTaco CookOut TacoBell CookOut DelTaco DelTaco BurgerKing DelTaco CookOut DelTaco TacoBell BurgerKing DelTaco TacoBell TacoBell DelTaco CookOut TacoBell 1. Make a table that contains the frequency and relative frequency. (Express relative frequency as a percentage rounded to one decimal place; for example 0.2512 should be 25.1%) 2. Make a bar chart to reflect the raw data 3. Make a pie chart
Step by Step Solution
There are 3 Steps involved in it

Get step-by-step solutions from verified subject matter experts