

Question: Its a Matlab question. Thank you! Use the code below for a new script in the matlab editor window. The code creates some fake data

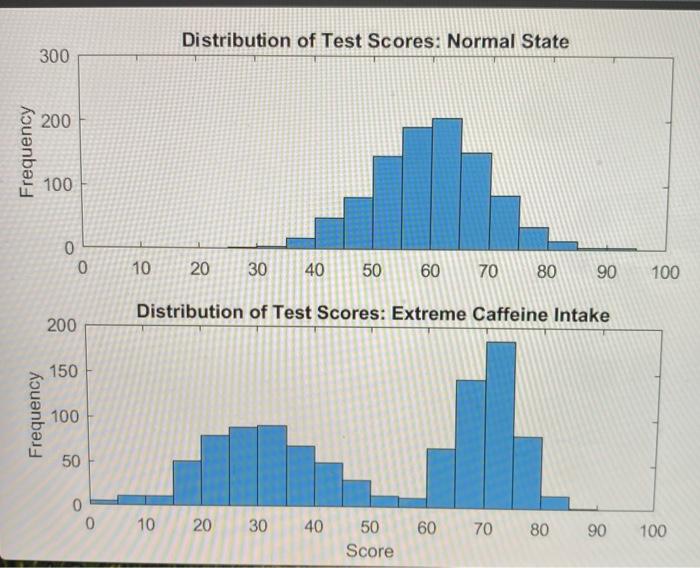
Use the code below for a new script in the matlab editor window. The code creates some fake data involving a fictitious experiment where 1000 individuals are tested under no caffeine (scores1) vs. lots of caffeine (scores2). Use the data in the vectors scorest and scores2 for your plot. Add code to create a figure as shown below that shows two histograms of the data. You can use the histogram command for this problem (it might help to read Matlab documentation for this function). In particular, you should use the syntax of the histogram function where the second input variable is not the number of bins, but the bin edges (i.e., a vector). Note that the bins for both the top and bottom panel start at 0, end at 100 and are spaced five units apart. The two panels should be in one Matlab figure. In the answer box, paste the Matlab code (multiple lines are fine) that you used to recreate this figure. rng( 1 ): % Set the seed of the random number generator scores1 - randn( 1090,1 *10 + 60; % Create fake data of 1000 values in condition 1 scores2 [randn 500,1 )*10+30; randn 500,1 )*5+70 ]: % create fake data of 1000 values for condition 2 22 Edit View Insert Format Tools Table 1rem Paragraph Distribution of Test Scores: Normal State 300 200 Frequency 100 0 0 10 20 30 40 50 60 70 80 90 100 Distribution of Test Scores: Extreme Caffeine Intake 200 150 Frequency 100 50 0 0 10 20 30 40 60 70 80 90 50 Score 100
Step by Step Solution
There are 3 Steps involved in it

Get step-by-step solutions from verified subject matter experts