

Question: IV Bolus - Example 4 Question: After an I.V . bolus dose of 5 0 0 m g the data collected in Table 4 .
IV Bolus Example
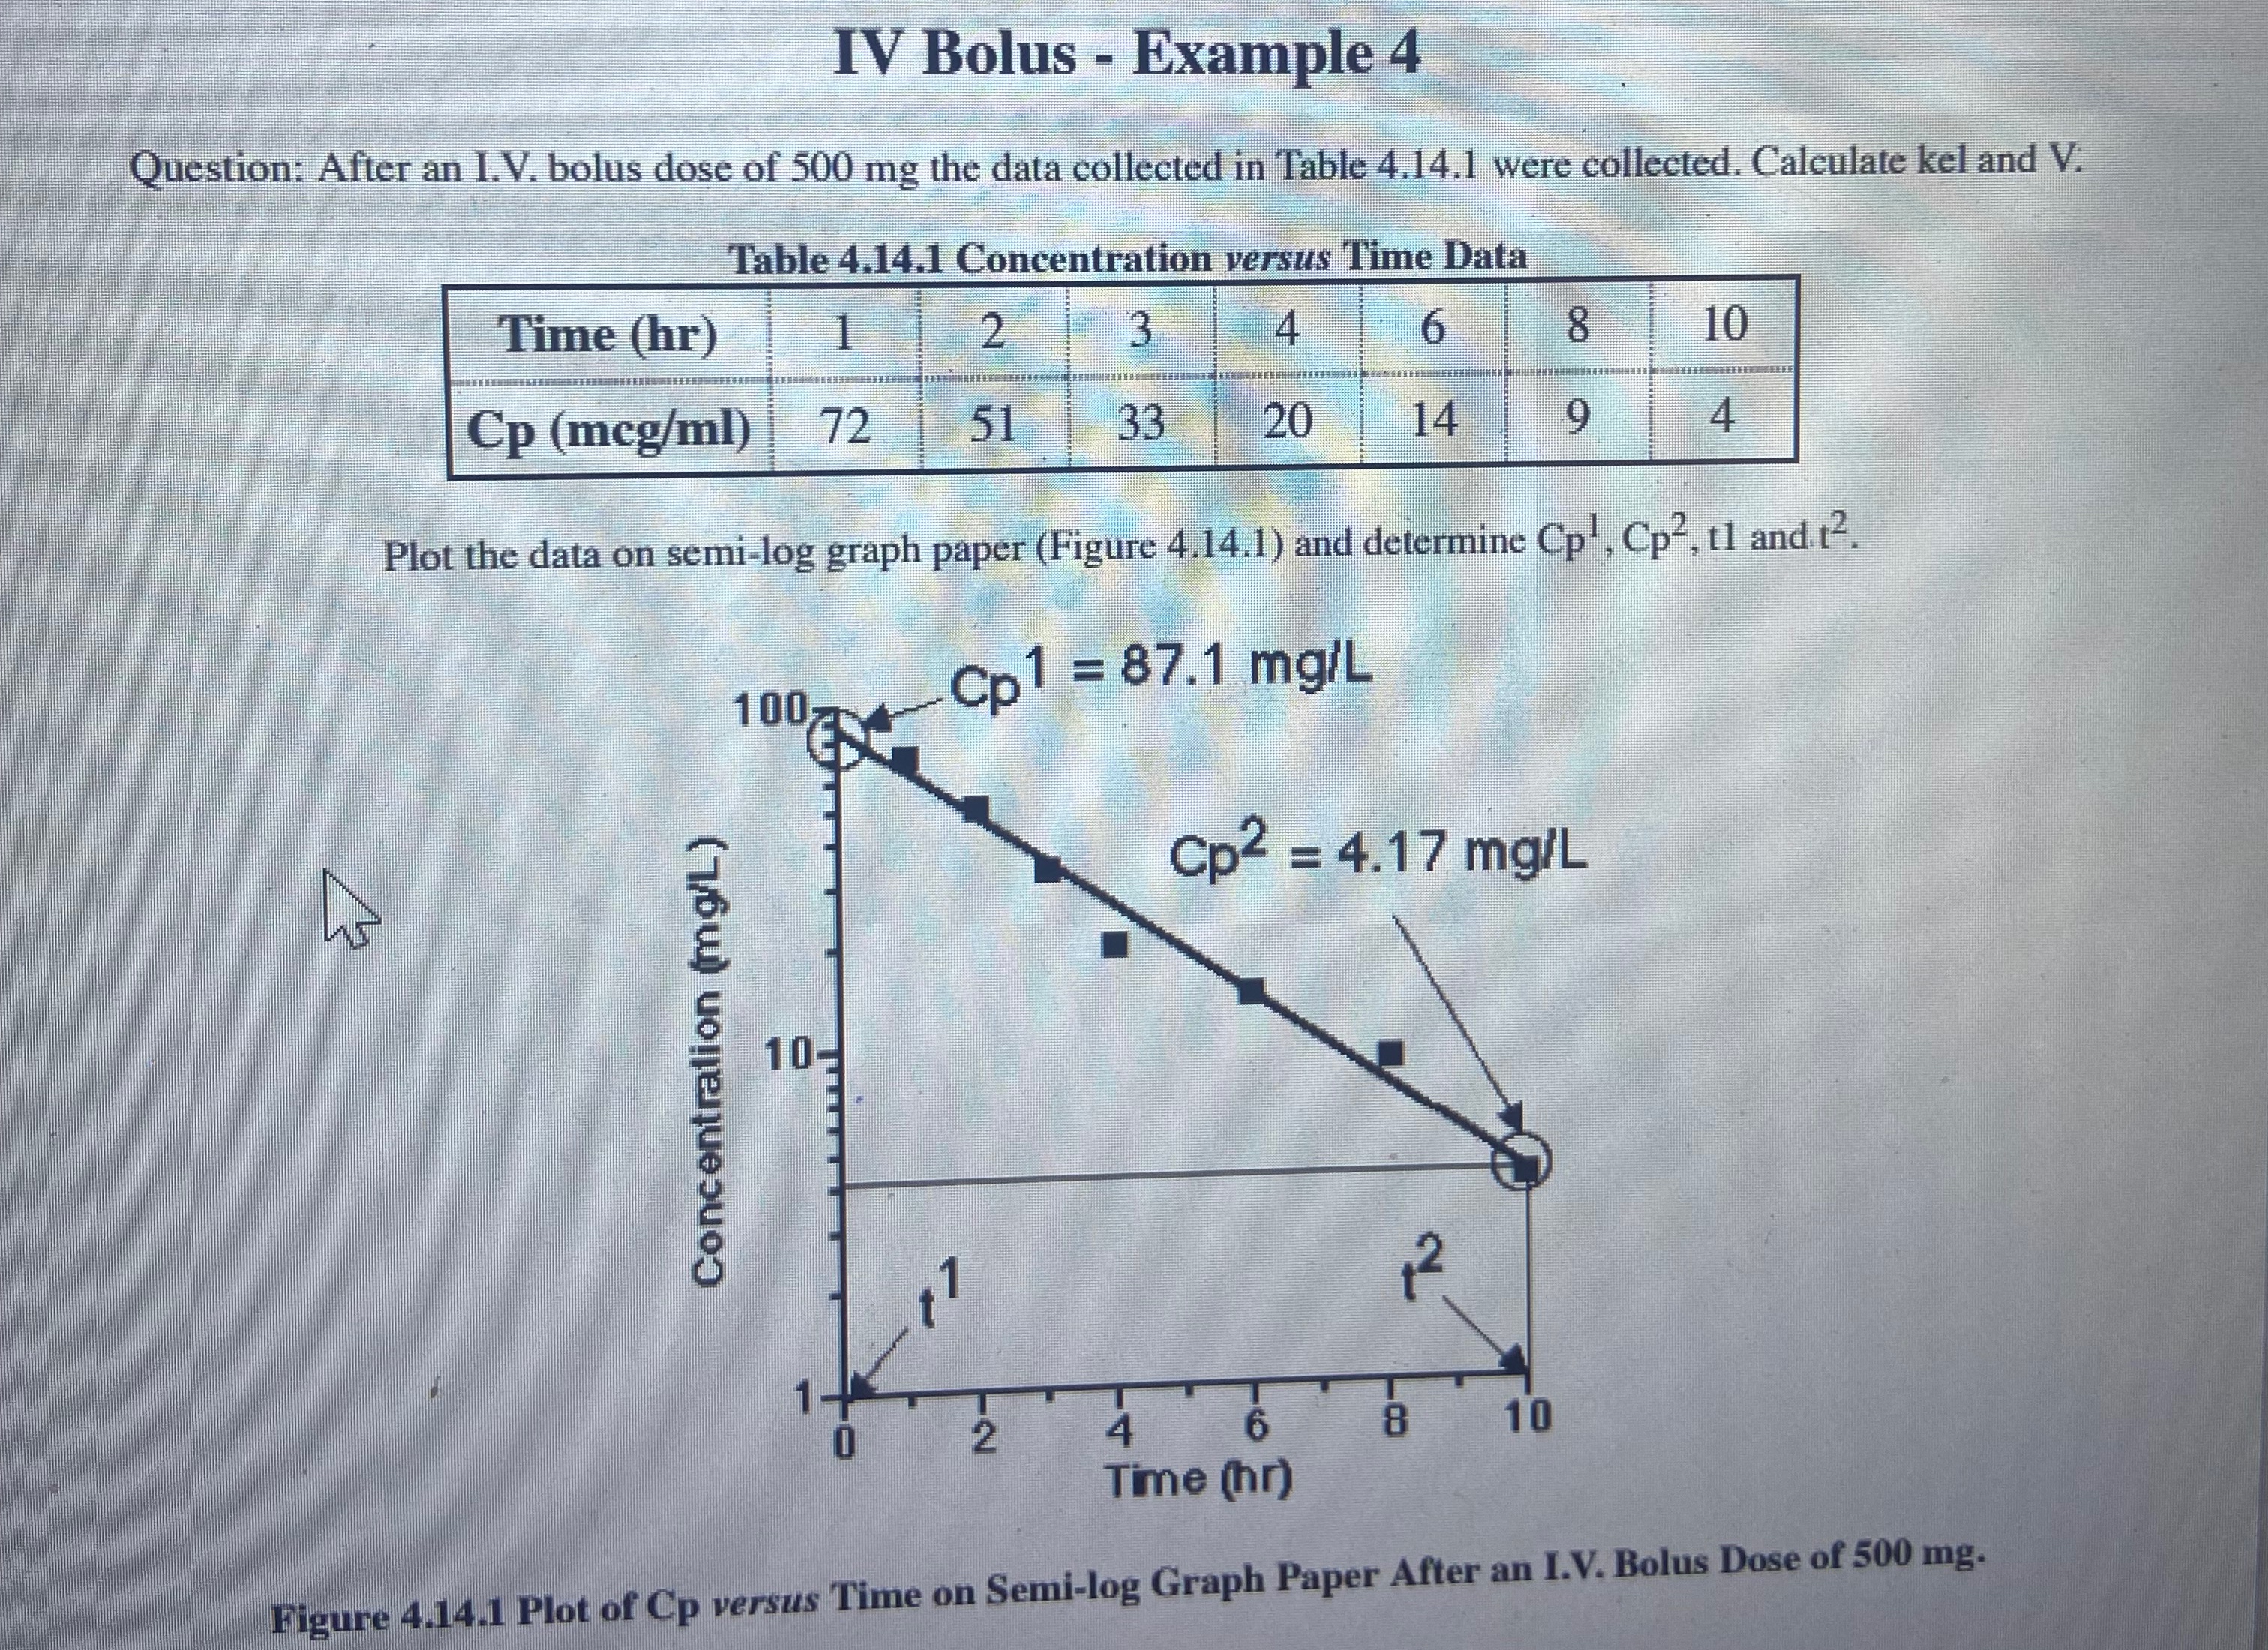
Question: After an I.V bolus dose of the data collected in Table were collected. Calculate kel and V
Table Concentration versus Time Data
tableTime hr
Plot the data on semilog graph paper Figure and determine and
Figure Plot of Cp versus Time on Semilog Graph Paper After an I.V Bolus Dose of
Step by Step Solution
There are 3 Steps involved in it
1 Expert Approved Answer
Step: 1 Unlock

Question Has Been Solved by an Expert!
Get step-by-step solutions from verified subject matter experts
Step: 2 Unlock
Step: 3 Unlock