Question: IV. PART 2: S&S COMPANY'S MANUFACTURING PROCESSES AND OVERHEAD ALLOCATION SYSTEM S&S Company manufactured its products (semiconductors) using two processes: the front-end process, in which
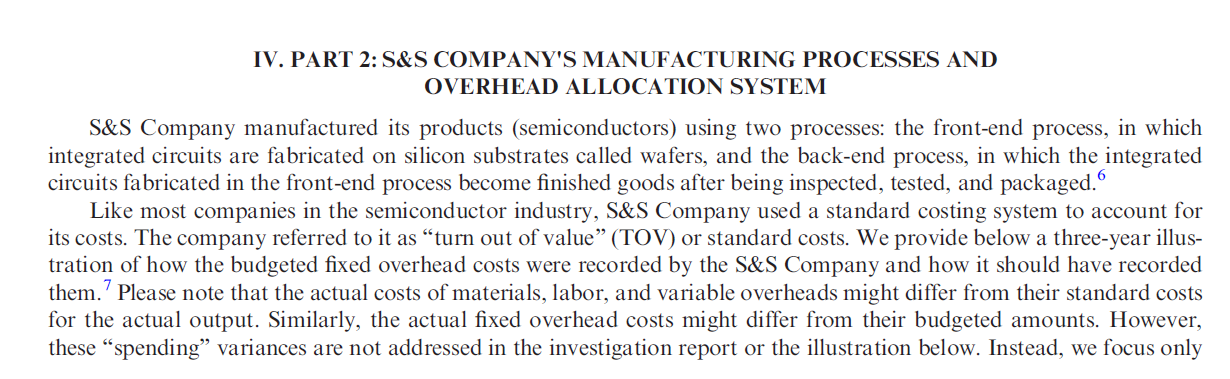
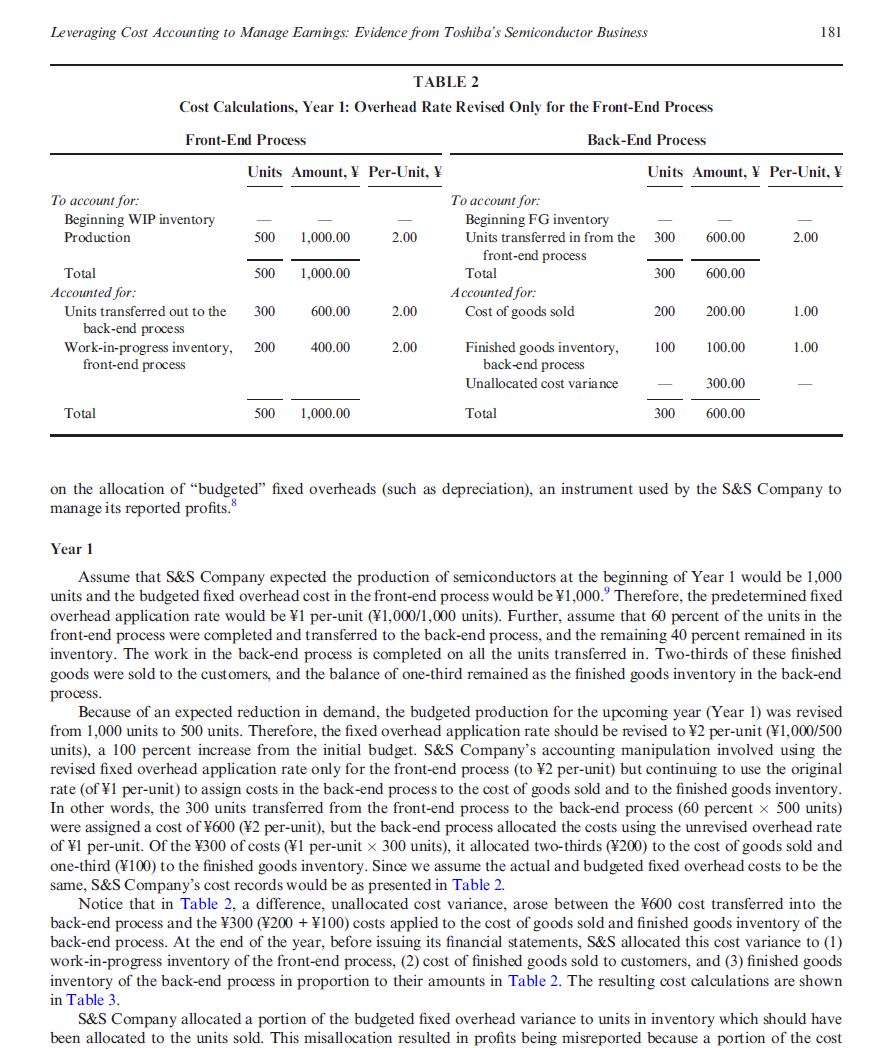
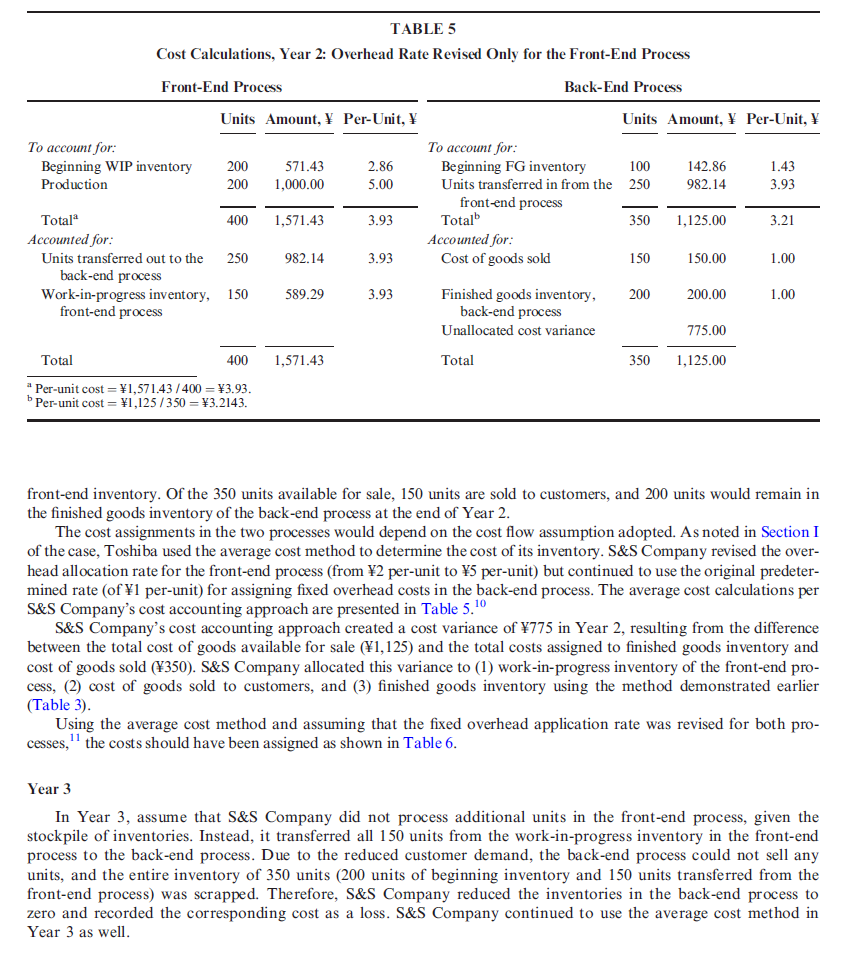
IV. PART 2: S&S COMPANY'S MANUFACTURING PROCESSES AND OVERHEAD ALLOCATION SYSTEM S&S Company manufactured its products (semiconductors) using two processes: the front-end process, in which integrated circuits are fabricated on silicon substrates called wafers, and the back-end process, in which the integrated circuits fabricated in the front-end process become finished goods after being inspected, tested, and packaged. Like most companies in the semiconductor industry, S&S Company used a standard costing system to account for its costs. The company referred to it as \"turn out of value\" (TOV) or standard costs. We provide below a three-year illus- tration of how the budgeted fixed overhead costs were recorded by the S&S Company and how it should have recorded them.\" Please note that the actual costs of materials, labor, and variable overheads might difter from their standard costs for the actual output. Similarly, the actual fixed overhead costs might differ from their budgeted amounts. However, these \"spending\" variances are not addressed in the investigation report or the illustration below. Instead, we focus only Leveraging Cost Accounting to Manage Earnings: Evidence from Toshiba's Semiconductor Business 181 TABLE 2 Cost Calculations, Year 1: Overhead Rate Revised Only for the Front-End Process Front-End Process Back-End Process Units Amount, Per-Unit, Units Amount, Per-Unit, To account for: To account for: Beginning WIP inventory Beginning FG inventory Production 500 1,000.00 2, Units transferred in from the 300 600.00 2. - front-end process _ Total 500 1,000.00 Total 300 600.00 Accounted for: Accounted for: Units transferred out to the 300 600.00 2.00 Cost of goods sold 200 200.00 L.00 back-end process Work-in-progress inventory, 200 400.00 2.00 Finished goods inventory, 100 100.00 L.00 front-end process back-end process Unallocated cost variance 300.00 Total 500 1,000.00 Total 300 600.00 on the allocation of \"budgeted\" fixed overheads (such as depreciation), an instrument used by the S&S Company to manage its reported profits.* Year 1 Assume that S&S Company expected the production of semiconductors at the beginning of Year 1 would be 1,000 units and the budgeted fixed overhead cost in the front-end process would be 1,000.\" Therefore, the predetermined fixed overhead application rate would be 1 per-unit (1,000/1,000 units). Further, assume that 60 percent of the units in the front-end process were completed and transferred to the back-end process, and the remaining 40 percent remained in its inventory. The work in the back-end process is completed on all the units transferred in. Two-thirds of these finished goods were sold to the customers, and the balance of one-third remained as the finished goods inventory in the back-end process. Because of an expected reduction in demand, the budgeted production for the upcoming year (Year 1) was revised from 1,000 units to 500 units. Therefore, the fixed overhead application rate should be revised to 2 per-unit (1,000/500 units), a 100 percent increase from the initial budget. S&S Company's accounting manipulation involved using the revised fixed overhead application rate only for the front-end process (to 2 per-unit) but continuing to use the original rate (of 1 per-unit) to assign costs in the back-end process Lo the cost of goods sold and to the finished goods inventory. In other words, the 300 units transferred from the front-end process to the back-end process (60 percent x 500 units) were assigned a cost of 600 (2 per-unit), but the back-end process allocated the costs using the unrevised overhead rate of 1 per-unit. Of the 300 of costs (1 per-unit 300 units), it allocated two-thirds (200) to the cost of goods sold and one-third (100) to the finished goods inventory. Since we assume the actual and budgeted fixed overhead costs to be the same, S&S Company's cost records would be as presented in Table 2. Notice that in Table 2, a difference, unallocated cost variance, arose between the 600 cost transferred into the back-end process and the 300 (200 + 100) costs applied to the cost of goods sold and finished goods inventory of the back-end process. At the end of the year, before issuing its financial statements, S&S allocated this cost variance to (1) work-in-progress inventory of the front-end process, (2) cost of finished goods sold to customers, and (3) finished goods mnventory of the back-end process in proportion to their amounts in Table 2. The resulting cost calculations are shown in Table 3. S&S Company allocated a portion of the budgeted fixed overhead variance to units in inventory which should have been allocated to the units sold. This misallocation resulted in profits being misreported because a portion of the cost TABLE 5 Cost Calculations, Year 2: Overhead Rate Revised Only for the Front-End Process Front-End Process Back-End Process Units Amount, Per-Unit, Units Amount, Per-Unit, To account for: To account for: Beginning WIP inventory 200 571.43 2.86 Beginning FG inventory 100 142.86 1.43 Production 200 1,000.00 5.00 Units transferred in from the 250 982.14 3.93 _ front-end process e Total* 400 1,571.43 3.93 Total\" 350 1,125.00 3.21 Accounted for: Accounted for: Units transferred out to the 250 982.14 3.93 Cost of goods sold 150 150.00 1.00 back-end process Work-in-progress inventory, 150 589.29 3.93 Finished goods inventory, 200 200.00 1.00 front-end process back-end process Unallocated cost variance 775.00 Total 400 1,571.43 Total 350 1,125.00 * Per-unit cost = 1,571.43 /400 = 3.93. P Per-unit cost = 1,125 /350 = 3.2143. front-end inventory. Of the 350 units available for sale, 150 units are sold to customers, and 200 units would remain in the finished goods inventory of the back-end process at the end of Year 2. The cost assignments in the two processes would depend on the cost flow assumption adopted. Asnoted in Section I of the case, Toshiba used the average cost method to determine the cost of its inventory. S&S Company revised the over- head allocation rate for the front-end process (from 2 per-unit to 5 per-unit) but continued to use the original predeter- mined rate (of 1 per-unit) for assigning fixed overhead costs in the back-end process. The average cost calculations per S&S Company's cost accounting approach are presented in Table 5. S&S Company's cost accounting approach created a cost variance of 775 in Year 2, resulting from the difference between the total cost of goods available for sale (1,125) and the total costs assigned to finished goods inventory and cost of goods sold (350). S&S Company allocated this variance to (1) work-in-progress inventory of the front-end pro- cess, (2) cost of goods sold to customers, and (3) finished goods inventory using the method demonstrated earlier (Table 3). Using the average cost method and assuming that the fixed overhead application rate was revised for both pro- cesses,'! the costs should have been assigned as shown in Table 6. Year 3 In Year 3, assume that S&S Company did not process additional units in the front-end process, given the stockpile of inventories. Instead, it transferred all 150 units from the work-in-progress inventory in the [ront-end process to the back-end process. Due to the reduced customer demand, the back-end process could not sell any units, and the entire inventory of 350 units (200 units of beginning inventory and 150 units transferred from the front-end process) was scrapped. Therefore, S&S Company reduced the inventories in the back-end process to zero and recorded the corresponding cost as a loss. S&S Company continued to use the average cost method in Year 3 as well. TABLE 6 Cost Calculations, Year 2: Overhead Rate Revised for Both Processes Front-End Process Back-End Process Units Amount, Y Per-Unit, Y Units Amount, Y Per-Unit, V To account for: To account for: Beginning WIP inventory 200 400.00 2.00 Beginning FG inventory 100 200.00 2.00 Production 200 1,000.00 5.00 Units transferred in from the 250 875.00 3.50 front-end process Total 400 1,400.00 3.50 Total 350 1,075.00 3.07 Accounted for: Accounted for: Units transferred out to the 250 875.00 3.50 Cost of goods sold 150 460.71 3.07 back-end process Work-in-progress inventory, 150 525.00 3.50 Finished goods inventory, 200 614.29 3.07 front-end process back-end process Total 400 1,400.00 Total 350 1,075.00 *Per-unit cost = V1,400 / 400 = 13.50. Per-unit cost = VI,075/350 = V3.07. Requirement 2 (a) For Year 2, using S&S Company's cost accounting method (overhead allocation rate revised only for the front- end process), calculate the year-end balances (total and per-unit) for the work-in-progress inventory of the front- end process, cost of goods sold to customers, and finished goods inventory of the back-end process. Present your answer in the format below: Proportion Allocation Total Cost of the Total of 1775 Including Per-Unit, Item Units Amount, Y Amount Variance Variance, V Cost. V Work-in-progress inventory, front-end process Cost of finished goods sold to customers Finished goods inventory, back-end process Total b) For Year 3, compute the loss on scrapping under two independent assumptions: (1) overhead allocation rate was revised only for the front-end process (S&S Company's method), and (2) overhead allocation rate was revised for both the front-end and back-end processes (appropriate method). Present your answer in the formats pro- vided in Exhibit 1. Use the numbers calculated in Requirement 2a to complete Requirement 2b(i). (c) For Years 1 and 2, compute the understatement or overstatement of work-in-progress inventories in the front- end process, finished goods inventories in the back-end process, the cost of goods sold, and profits resulting from S&S Company revising the overhead allocation rate only for the front-end process. Also, compute the under- statement or overstatement of profits due to the inventory write-down in Year 3, resulting from S&S Company revising the overhead allocation rate only for the front-end process. Present your answers in the formats pro- vided in Exhibit 2. (d) Based on the information in the illustration provided in the section and your answer in Part C, would you con- sider Toshiba's misstatement in Years 1 and 2 material? How does it affect Toshiba's stakeholders?EXHIBIT 1 Cost Calculations for Year 3 under the Two Assumptions (1) Overhead allocation rate revised for only the front-end process (S&S Company's method). Front-End Process Back-End Process Units Amount, Y Per-Unit, Y Units Amount, $ Per-Unit, Y To account for: To account for: Beginning WIP inventory Beginning FG inventory Production Units transferred in from the front-end process Total Total Accounted for: Accounted for: Units transferred out to the Finished goods impairment back-end process loss recorded Work-in-progress inventory, Finished goods inventory, front-end process back-end process Total Total (2) Overhead allocation rate revised for both the front-end process and the back-end process. Front-End Process Back-End Process Units Amount, Y Per-Unit, V Units Amount, Y Per-Unit, To account for: To account for: Beginning WIP inventory Beginning FG inventory Production Units transferred in from the front-end process Total Total Accounted for: Accounted for: Units transferred out to the Finished goods impairment back-end process loss recorded Work-in-progress inventory, Finished goods inventory, front-end process back-end process Total Total
Step by Step Solution
There are 3 Steps involved in it
1 Expert Approved Answer
Step: 1 Unlock
Question Has Been Solved by an Expert!
Get step-by-step solutions from verified subject matter experts
Step: 2 Unlock
Step: 3 Unlock
Students Have Also Explored These Related Accounting Questions!