

Question: ive attached the problems and the charts to help solve the problems Standard deviation of the sampling means = ounces (round your response to three
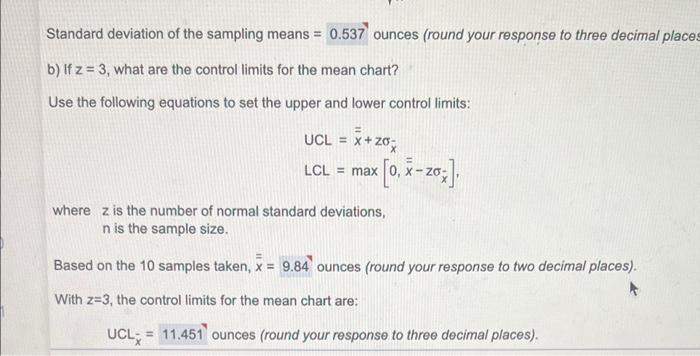
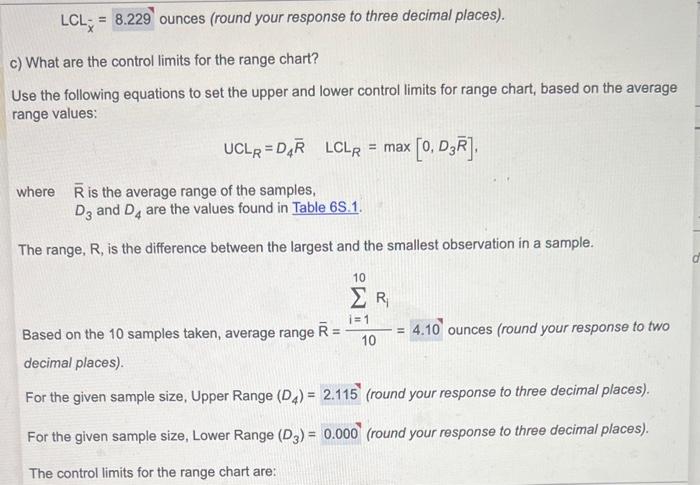
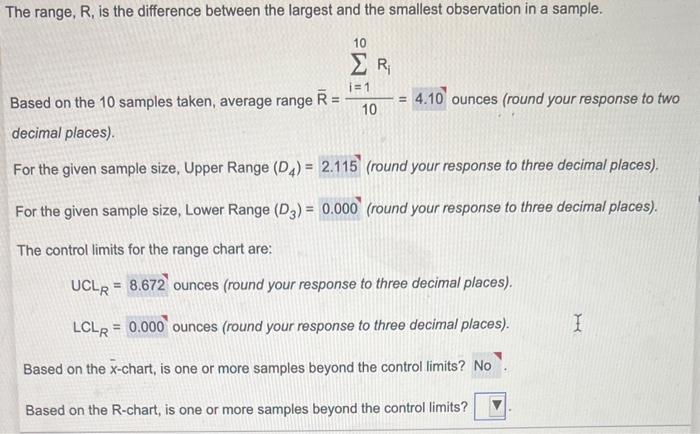
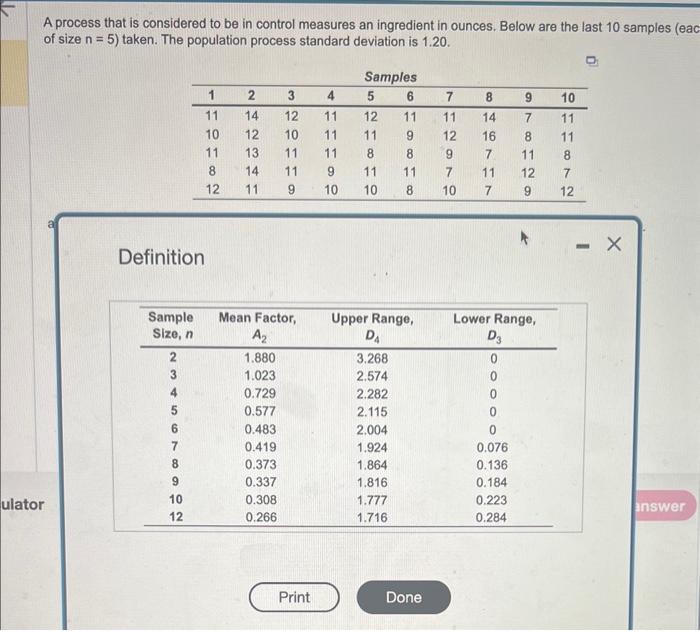
Standard deviation of the sampling means = ounces (round your response to three decimal place b) If z=3, what are the control limits for the mean chart? Use the following equations to set the upper and lower control limits: UCLLCL=x+zx=max[0,xzx], where z is the number of normal standard deviations, n is the sample size. Based on the 10 samples taken, x=9.84 ounces (round your response to two decimal places). With z=3, the control limits for the mean chart are: UCLx=ounces(roundyourresponsetothreedecimalplaces). LCLx=8.229 ounces (round your response to three decimal places). c) What are the control limits for the range chart? Use the following equations to set the upper and lower control limits for range chart, based on the average range values: UCLR=D4RLCLR=max[0,D3R] where R is the average range of the samples, D3 and D4 are the values found in Table 6S.1. The range, R, is the difference between the largest and the smallest observation in a sample. Based on the 10 samples taken, average range R=10i=110Ri=4.10 ounces (round your response to two decimal places). For the given sample size, Upper Range (D4)=2.115 (round your response to three decimal places). For the given sample size, Lower Range (D3)=0.000 (round your response to three decimal places). The control limits for the range chart are: Based on the 10 samples taken, average range R=10i=110=4.10 ounces (round your response to two decimal places). For the given sample size, Upper Range (D4)=2.115 (round your response to three decimal places). For the given sample size, Lower Range (D3)=0.000 (round your response to three decimal places). The control limits for the range chart are: UCLR=8.672 ounces (round your response to three decimal places). LCLR=0.000 ounces (round your response to three decimal places). Based on the x-chart, is one or more samples beyond the control limits? Based on the R-chart, is one or more samples beyond the control limits? A process that is considered to be in control measures an ingredient in ounces. Below are the last 10 samples (eac of size n=5 ) taken. The population process standard deviation is 1.20. Definition
Step by Step Solution
There are 3 Steps involved in it

Get step-by-step solutions from verified subject matter experts