

Question: I've been asked to create a cash versus sales chart and add a trend line. Is cash a consistent percentage of sales? And do a
I've been asked to create a cash versus sales chart and add a trend line. Is cash a consistent percentage of sales? And do a Regression Analysis as well. This is how I did it.
Q.-Do I need to divide cash/sales and use that percentage in order to create the chart and answer whether the percentage of sales is consistent? Or do I just use the cash and sales values as it shows in the picture below? What exactly makes a percentage of sales consistent? Thank you.
If anything, please answer whether the set up is correct and if the regression values are correct as well. Thank you kindly.
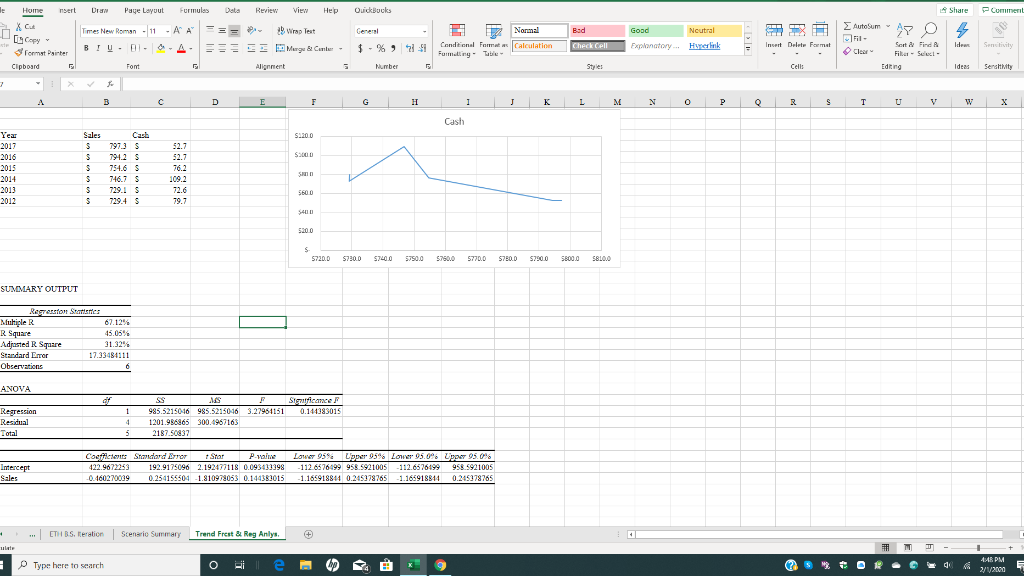
OuickBooks Share Comment Home mert Dram Page Layout Formulas Data Times New Roman - 11 - AA === [Copy romet Painter B ru - 01 - A Clipboard Font Normal Calculation Review View H elp Wrap Test Marge Cant . Alignment Bad Check Cell E Z Conditional Format Furmaling - Table Good E xplanatory. E Neutral Hyperlink Autosum 4 Idea _ ut Delite Formu 21:51 l e 47 0 Sort & Find & File - Sci- Editing $. % Number Suncitivity Styles Celle idem Sensitivity A B C D E F G H I J K L M N O P Q R S T U V W X Cash Sales S.200 52.7 Year 2017 2016 2015 52.7 76.2 797) S 7942S 754.6 S 746.75 729.1 S 729.4 S 2014 1092 72.6 2013 2012 5720. 0 5730. 0 57400 5750.0 5750. 0 5770. 0 5780.0 5790.0 56000 58.00 SUMMARY OUTPUT 67.1296 Regenen Satire Muhiple R R Square 45.05% Adjusted R Sqaure 31 3296 Standard Error 17.33981111 Observations ANOVA F Scancel 3.27951151 0.144383015 1 Regression Residual Total S 9 85.5215016985.5215016 1201.986865 300.4967163 2187.50837 4 5 Coefficients Standard Arnor 422.9672253 192.9175096 -0.460270039 0 .254155504 Star Praire 2.192477118 0.093410398 1.810978055 0.144333015 Lower 95% Lpper 95% Lower 95.06 Lipper 95.0% - 112.6576499 958. 5921005 -112.6576199 958 5921005 1.16591884 0.2051782651.165918314 0.245178765 - . THBS. Ieration Scenario Summary Trend Frest & Reg Anlys 448 PM Type here to search o Bi e re x 9 OR. V.200 OuickBooks Share Comment Home mert Dram Page Layout Formulas Data Times New Roman - 11 - AA === [Copy romet Painter B ru - 01 - A Clipboard Font Normal Calculation Review View H elp Wrap Test Marge Cant . Alignment Bad Check Cell E Z Conditional Format Furmaling - Table Good E xplanatory. E Neutral Hyperlink Autosum 4 Idea _ ut Delite Formu 21:51 l e 47 0 Sort & Find & File - Sci- Editing $. % Number Suncitivity Styles Celle idem Sensitivity A B C D E F G H I J K L M N O P Q R S T U V W X Cash Sales S.200 52.7 Year 2017 2016 2015 52.7 76.2 797) S 7942S 754.6 S 746.75 729.1 S 729.4 S 2014 1092 72.6 2013 2012 5720. 0 5730. 0 57400 5750.0 5750. 0 5770. 0 5780.0 5790.0 56000 58.00 SUMMARY OUTPUT 67.1296 Regenen Satire Muhiple R R Square 45.05% Adjusted R Sqaure 31 3296 Standard Error 17.33981111 Observations ANOVA F Scancel 3.27951151 0.144383015 1 Regression Residual Total S 9 85.5215016985.5215016 1201.986865 300.4967163 2187.50837 4 5 Coefficients Standard Arnor 422.9672253 192.9175096 -0.460270039 0 .254155504 Star Praire 2.192477118 0.093410398 1.810978055 0.144333015 Lower 95% Lpper 95% Lower 95.06 Lipper 95.0% - 112.6576499 958. 5921005 -112.6576199 958 5921005 1.16591884 0.2051782651.165918314 0.245178765 - . THBS. Ieration Scenario Summary Trend Frest & Reg Anlys 448 PM Type here to search o Bi e re x 9 OR. V.200
Step by Step Solution
There are 3 Steps involved in it

Get step-by-step solutions from verified subject matter experts