

Question: I've been assigned brooklyn and the bronx 11:21 11:21 < Back Research Report.docx Principles of Microeconomics Spring, 2021 Research Report: Data Collection and Interpretation This
I've been assigned brooklyn and the bronx
11:21
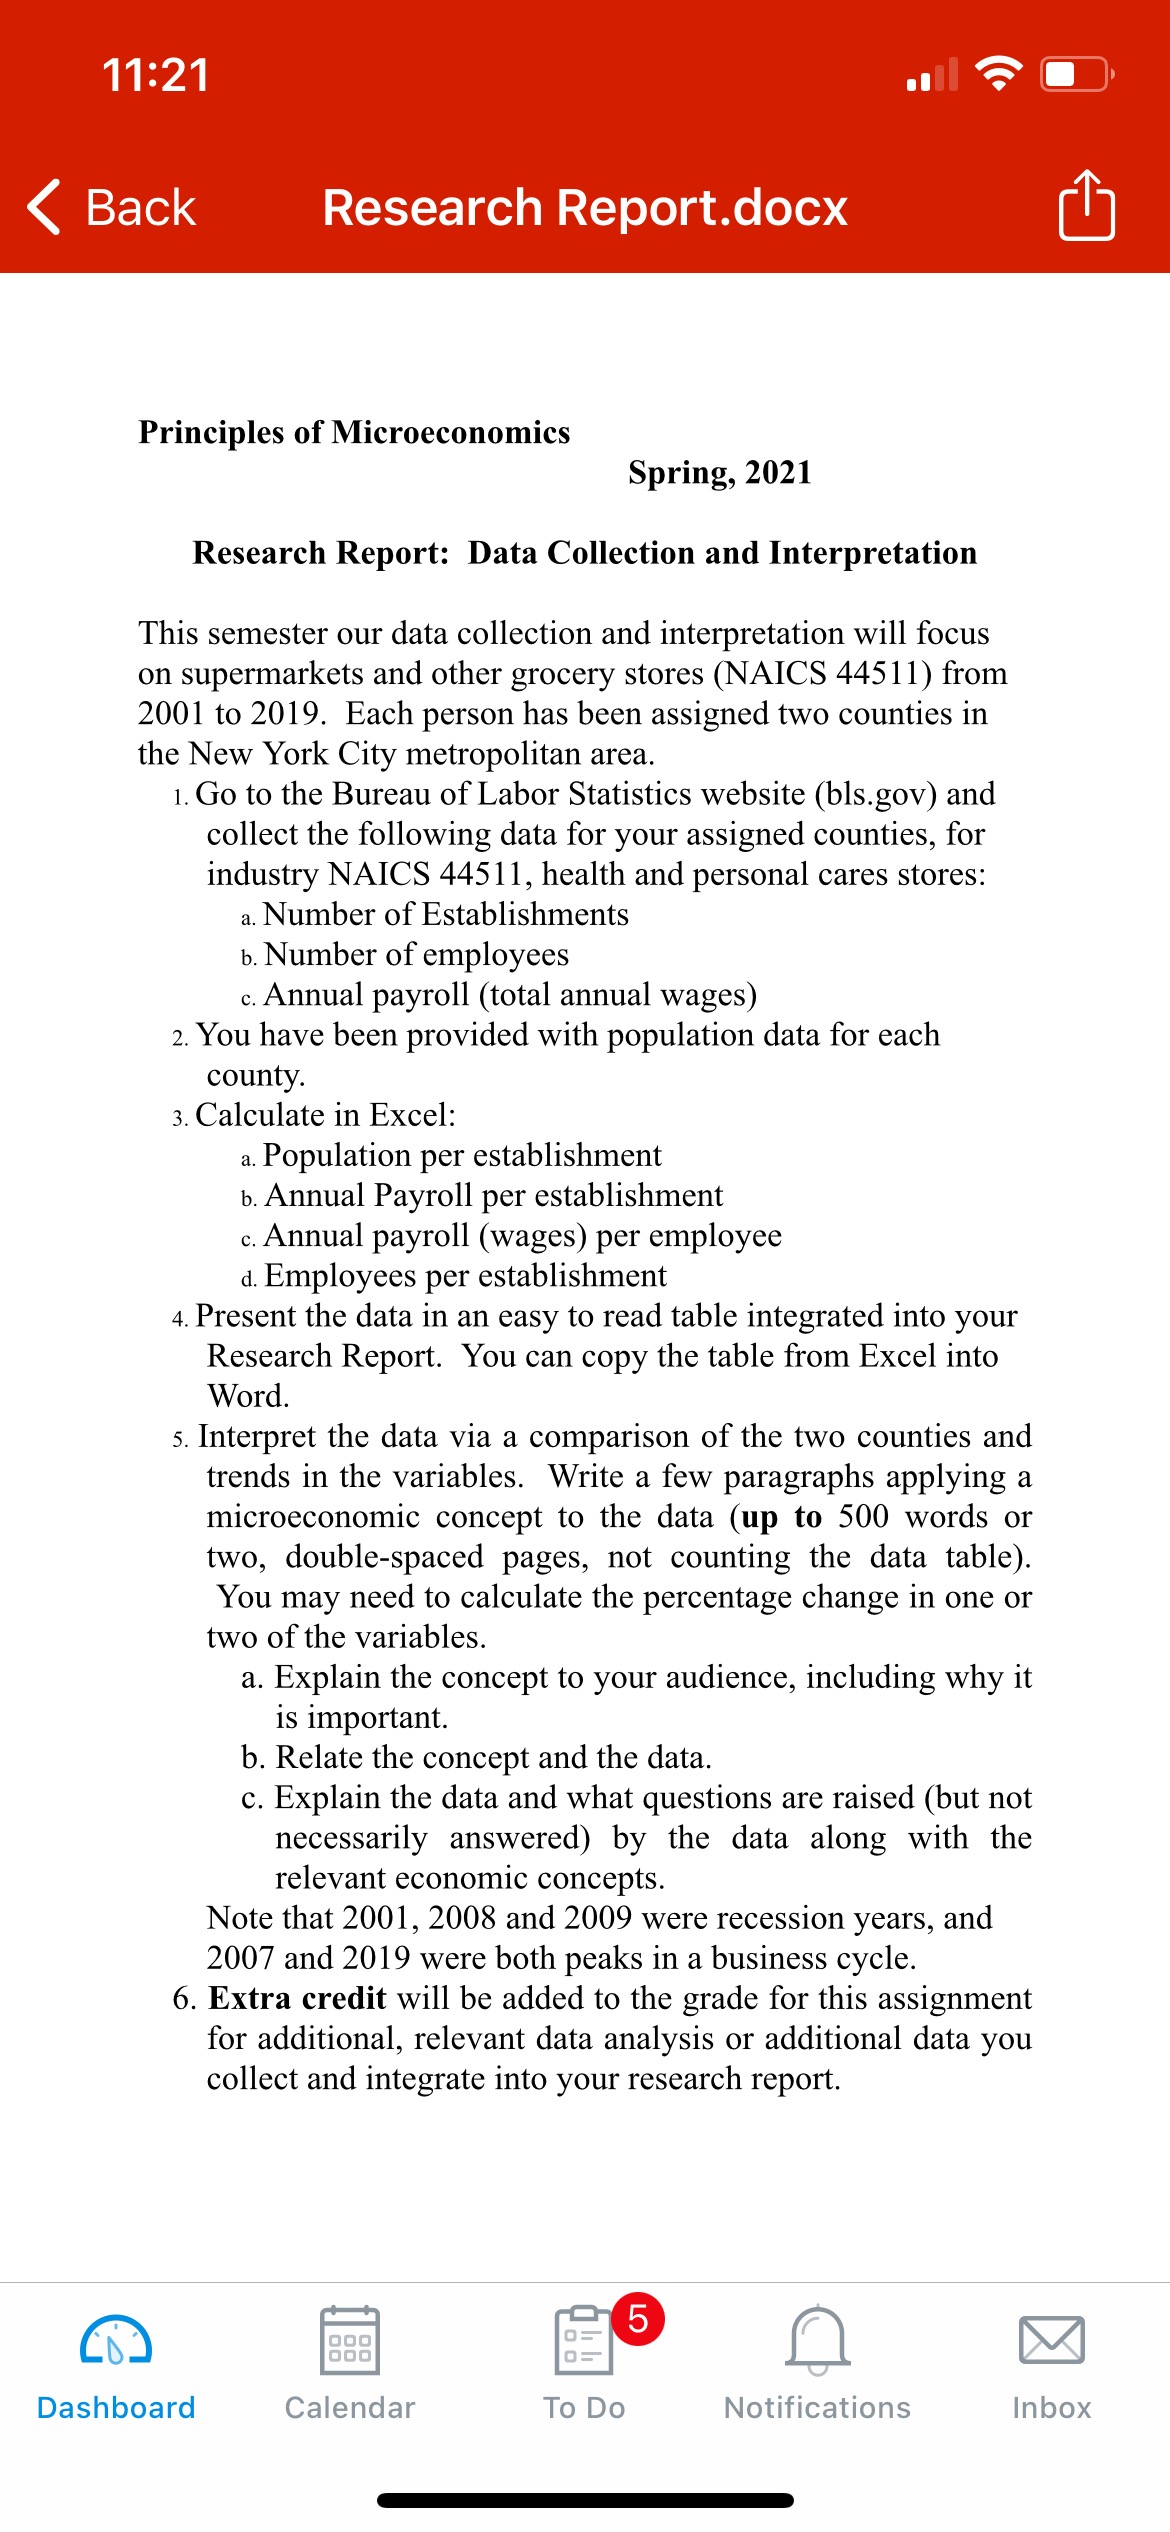
11:21 < Back Research Report.docx Principles of Microeconomics Spring, 2021 Research Report: Data Collection and Interpretation This semester our data collection and interpretation will focus on supermarkets and other grocery stores (NAICS 44511) from 2001 to 2019. Each person has been assigned two counties in the New York City metropolitan area. 1. Go to the Bureau of Labor Statistics website (bls.gov) and collect the following data for your assigned counties, for industry NAICS 44511, health and personal cares stores: a Number of Establishments b. Number of employees c. Annual payroll (total annual wages) 2. You have been provided with population data for each county. 3. Calculate in Excel: a. Population per establishment b. Annual Payroll per establishment Annual payroll (wages) per employee d. Employees per establishment 4. Present the data in an easy to read table integrated into your Research Report. You can copy the table from Excel into Word. 5. Interpret the data via a comparison of the two counties and trends in the variables. Write a few paragraphs applying a microeconomic concept to the data (up to 500 words or two, double-spaced pages, not counting the data table). You may need to calculate the percentage change in one or two of the variables. a. Explain the concept to your audience, including why it is important. b. Relate the concept and the data. c. Explain the data and what questions are raised (but not necessarily answered) by the data along with the relevant economic concepts. Note that 2001, 2008 and 2009 were recession years, and 2007 and 2019 were both peaks in a business cycle. 6. Extra credit will be added to the grade for this assignment for additional, relevant data analysis or additional data you collect and integrate into your research report. Dashboard ooo ooo Calendar To Do Notifications Inbox
Step by Step Solution
There are 3 Steps involved in it

Get step-by-step solutions from verified subject matter experts