

Question: I've finished i. : here is my code # importing module from statistics import mean import random import numpy as np # numpy.random.uniform() method random_array
I've finished i. : here is my code
# importing module from statistics import mean import random import numpy as np # numpy.random.uniform() method random_array = np.random.uniform(0.0, 2.0, 10)
# printing 1D array with 10 random samples that are uniformly distributed in the range of [0,2] print("1D Array with random values : ", random_array)
#computing mean of 5 numbers
def Average(l): avg = mean(l) return avg my_list = random.choices(random_array, k=5) average = Average(my_list) print("Random selected 5 numbers from list are :", my_list) print ("Average of my_list is", average)
Need help with ii-vi
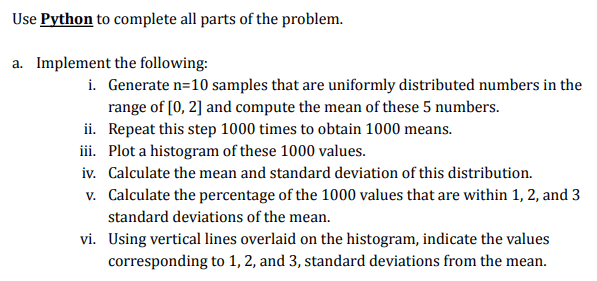
Use Python to complete all parts of the problem. a. Implement the following: i. Generate n=10 samples that are uniformly distributed numbers in the range of [0,2] and compute the mean of these 5 numbers. ii. Repeat this step 1000 times to obtain 1000 means. iii. Plot a histogram of these 1000 values. iv. Calculate the mean and standard deviation of this distribution. v. Calculate the percentage of the 1000 values that are within 1,2 , and 3 standard deviations of the mean. vi. Using vertical lines overlaid on the histogram, indicate the values corresponding to 1,2 , and 3 , standard deviations from the mean
Step by Step Solution
There are 3 Steps involved in it

Get step-by-step solutions from verified subject matter experts