

Question: I've got the first problem done. please help with with writing the code without the data. PROBLEM 1'S GRAPH LOOKS LIKE THIS The attached is
I've got the first problem done.
please help with with writing the code without the data.
PROBLEM 1'S GRAPH LOOKS LIKE THIS
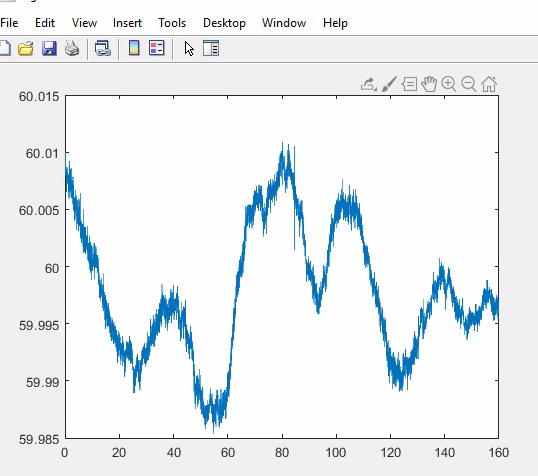
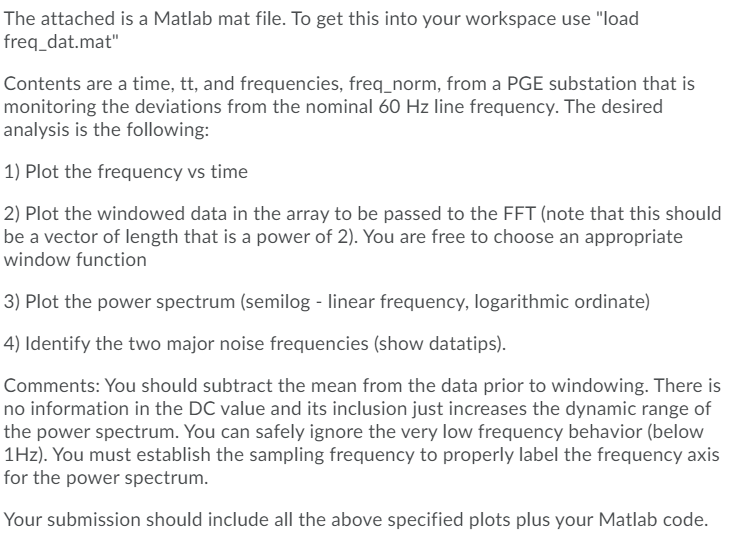
The attached is a Matlab mat file. To get this into your workspace use "load freq_dat.mat" Contents are a time, tt, and frequencies, freq_norm, from a PGE substation that is monitoring the deviations from the nominal 60 Hz line frequency. The desired analysis is the following: 1) Plot the frequency vs time 2) Plot the windowed data in the array to be passed to the FFT (note that this should be a vector of length that is a power of 2). You are free to choose an appropriate window function 3) Plot the power spectrum (semilog - linear frequency, logarithmic ordinate) 4) Identify the two major noise frequencies (show datatips). Comments: You should subtract the mean from the data prior to windowing. There is no information in the DC value and its inclusion just increases the dynamic range of the power spectrum. You can safely ignore the very low frequency behavior (below 1Hz). You must establish the sampling frequency to properly label the frequency axis for the power spectrum. Your submission should include all the above specified plots plus your Matlab code. File Edit View Insert Tools Desktop Window Help C3 60.015 60.01 60.005 60 59.995 59.99 59.985 0 20 40 60 80 100 120 140 160 The attached is a Matlab mat file. To get this into your workspace use "load freq_dat.mat" Contents are a time, tt, and frequencies, freq_norm, from a PGE substation that is monitoring the deviations from the nominal 60 Hz line frequency. The desired analysis is the following: 1) Plot the frequency vs time 2) Plot the windowed data in the array to be passed to the FFT (note that this should be a vector of length that is a power of 2). You are free to choose an appropriate window function 3) Plot the power spectrum (semilog - linear frequency, logarithmic ordinate) 4) Identify the two major noise frequencies (show datatips). Comments: You should subtract the mean from the data prior to windowing. There is no information in the DC value and its inclusion just increases the dynamic range of the power spectrum. You can safely ignore the very low frequency behavior (below 1Hz). You must establish the sampling frequency to properly label the frequency axis for the power spectrum. Your submission should include all the above specified plots plus your Matlab code. File Edit View Insert Tools Desktop Window Help C3 60.015 60.01 60.005 60 59.995 59.99 59.985 0 20 40 60 80 100 120 140 160
Step by Step Solution
There are 3 Steps involved in it

Get step-by-step solutions from verified subject matter experts