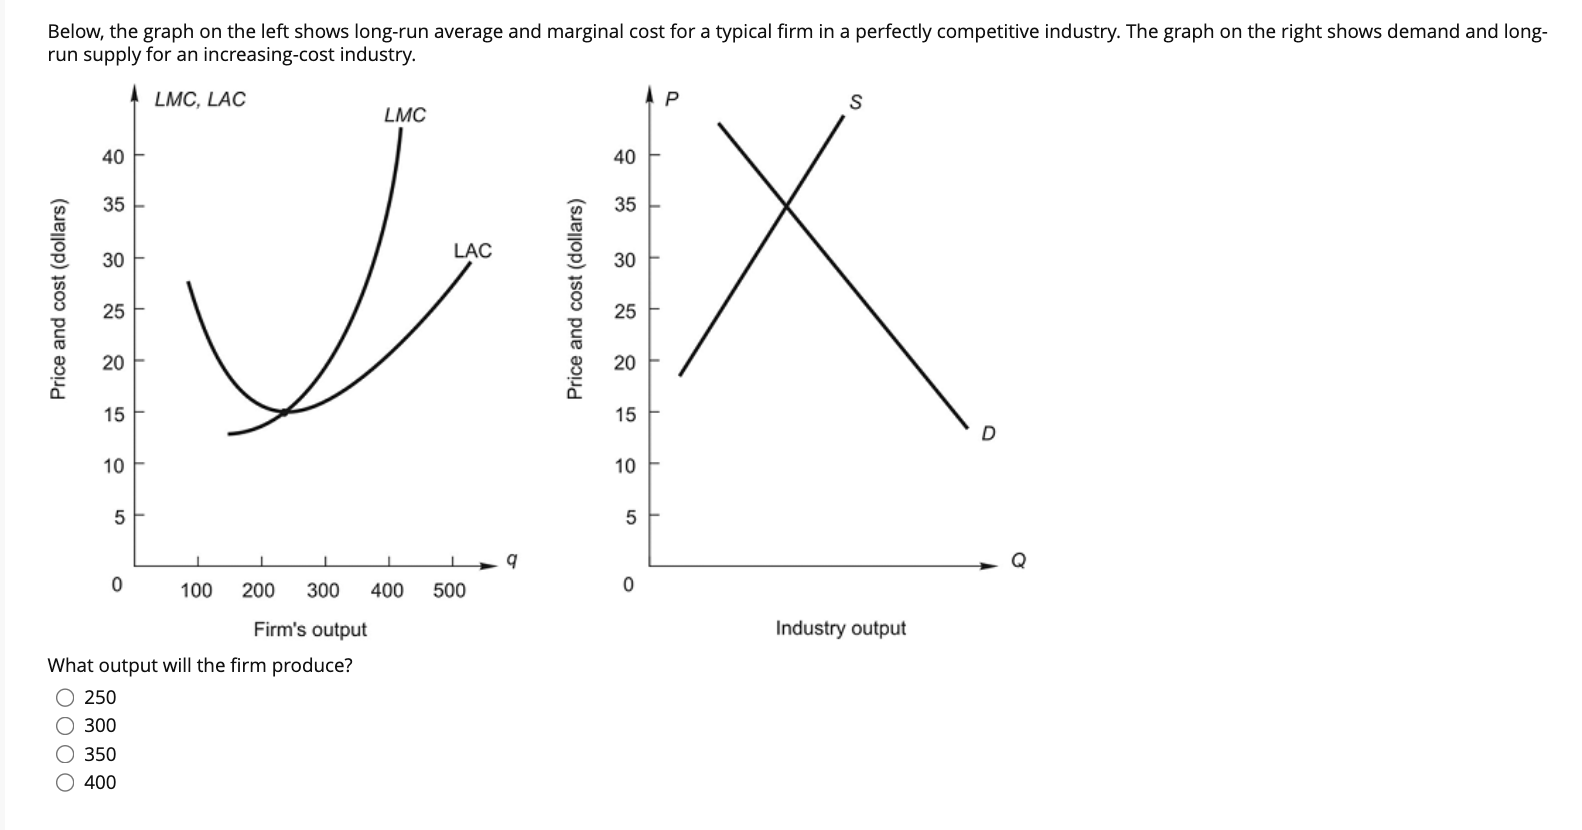
Question: j Below, the graph on the left shows long-run average and marginal cost for a typical firm in a perfectly competitive industry. The graph on

j

j Below, the graph on the left shows long-run
Below, the graph on the left shows long-run average and marginal cost for a typical firm in a perfectly competitive industry. The graph on the right shows demand and long- run supply for an increasing-cost industry. LMC, LAC A P LMC 40 40 35 35 30 LAC 30 Price and cost (dollars) Price and cost (dollars) 25 25 20 20 15 15 D 10 10 5 5 - Q 0 100 200 300 400 500 0 Firm's output Industry output What output will the firm produce? O 250 O 300 O 350 O 400

Step by Step Solution

There are 3 Steps involved in it

1 Expert Approved Answer
Step: 1 Unlock blur-text-image
Question Has Been Solved by an Expert!

Get step-by-step solutions from verified subject matter experts

Step: 2 Unlock
Step: 3 Unlock

Students Have Also Explored These Related General Management Questions!