

Question: Janie has been given the following simulation output graph by the stutislies department. She needs to decide which altemative to recommend and why? The folks
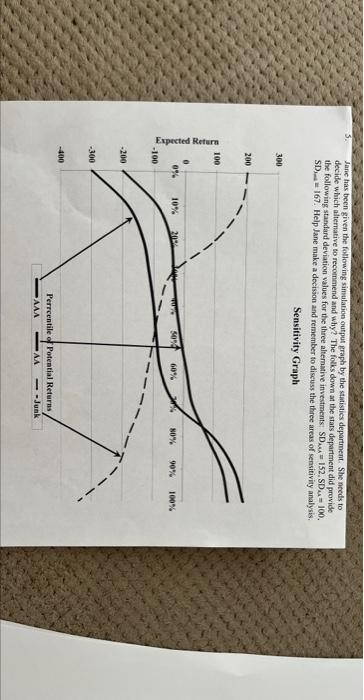
Janie has been given the following simulation output graph by the stutislies department. She needs to decide which altemative to recommend and why? The folks down at the stats department did provide the following standard deviation values for the three alternative investments SDAss=152.SDL=100. SDman=167. Help Jane make a decision and remember to diseuss the three areas of sensitivity analysis. Janie has been given the following simulation output graph by the stutislies department. She needs to decide which altemative to recommend and why? The folks down at the stats department did provide the following standard deviation values for the three alternative investments SDAss=152.SDL=100. SDman=167. Help Jane make a decision and remember to diseuss the three areas of sensitivity analysis
Step by Step Solution
There are 3 Steps involved in it

Get step-by-step solutions from verified subject matter experts