

Question: Jocelyn is interested in developing study strategies to help their students learn the course material. they decide to investigate the effects of two study strategies:
- Jocelyn is interested in developing study strategies to help their students learn the course material. they decide to investigate the effects of two study strategies: imagery and rote memorization. Jocelyn recruits 20 pilot subjects from an introductory biology course and randomly assigns ten participants to each of the two conditions: imagery or rote memorization. Handedness is believed to reflect hemisphere activation, so Jocelyn recruits ten right and ten left-hand dominant participants. participants are given the same psychobiology chapter to read and are led through a demonstration of learning the material using one of the four strategies. participants are then given a biology quiz to test their memory of the material. their data is presented below: Complete questions 1-4 as best as you can.
a. state the null and alternative hypotheses for this study in words and using statistical symbols
Case Processing Summary | |||||||
Strategy | Cases | ||||||
Valid | Missing | Total | |||||
N | Percent | N | Percent | N | Percent | ||
Accuracy | imagery | 11 | 100.0% | 0 | 0.0% | 11 | 100.0% |
rote | 9 | 100.0% | 0 | 0.0% | 9 | 100.0% |
Descriptives | ||||
Strategy | Statistic | Std. Error | ||
Accuracy | imagery | Mean | .4364 | .05604 |
95% Confidence Interval for Mean | Lower Bound | .3115 | ||
Upper Bound | .5612 | |||
5% Trimmed Mean | .4293 | |||
Median | .4000 | |||
Variance | .035 | |||
Std. Deviation | .18586 | |||
Minimum | .20 | |||
Maximum | .80 | |||
Range | .60 | |||
Interquartile Range | .30 | |||
Skewness | .491 | .661 | ||
Kurtosis | -.189 | 1.279 | ||
rote | Mean | .7444 | .02940 | |
95% Confidence Interval for Mean | Lower Bound | .6767 | ||
Upper Bound | .8122 | |||
5% Trimmed Mean | .7438 | |||
Median | .7000 | |||
Variance | .008 | |||
Std. Deviation | .08819 | |||
Minimum | .60 | |||
Maximum | .90 | |||
Range | .30 | |||
Interquartile Range | .10 | |||
Skewness | .214 | .717 | ||
Kurtosis | .144 | 1.400 |
Case Processing Summary | |||||||
Handedness | Cases | ||||||
Valid | Missing | Total | |||||
N | Percent | N | Percent | N | Percent | ||
Accuracy | Left | 11 | 100.0% | 0 | 0.0% | 11 | 100.0% |
Right | 9 | 100.0% | 0 | 0.0% | 9 | 100.0% |
Descriptives | ||||
Handedness | Statistic | Std. Error | ||
Accuracy | Left | Mean | .4273 | .05062 |
95% Confidence Interval for Mean | Lower Bound | .3145 | ||
Upper Bound | .5401 | |||
5% Trimmed Mean | .4247 | |||
Median | .4000 | |||
Variance | .028 | |||
Std. Deviation | .16787 | |||
Minimum | .20 | |||
Maximum | .70 | |||
Range | .50 | |||
Interquartile Range | .30 | |||
Skewness | .096 | .661 | ||
Kurtosis | -1.113 | 1.279 | ||
Right | Mean | .7556 | .02940 | |
95% Confidence Interval for Mean | Lower Bound | .6878 | ||
Upper Bound | .8233 | |||
5% Trimmed Mean | .7562 | |||
Median | .8000 | |||
Variance | .008 | |||
Std. Deviation | .08819 | |||
Minimum | .60 | |||
Maximum | .90 | |||
Range | .30 | |||
Interquartile Range | .10 | |||
Skewness | -.214 | .717 | ||
Kurtosis | .144 | 1.400 |
Univariate Analysis of Variance
Between-Subjects Factors | |||
Value Label | N | ||
Strategy | 1.1 | imagery | 11 |
2.2 | rote | 9 | |
Handedness | 3.3 | Left | 11 |
4.4 | Right | 9 |
Descriptive Statistics | ||||
| Dependent Variable: Accuracy | ||||
Strategy | Handedness | Mean | Std. Deviation | N |
imagery | Left | .4000 | .14907 | 10 |
Right | .8000 | . | 1 | |
Total | .4364 | .18586 | 11 | |
rote | Left | .7000 | . | 1 |
Right | .7500 | .09258 | 8 | |
Total | .7444 | .08819 | 9 | |
Total | Left | .4273 | .16787 | 11 |
Right | .7556 | .08819 | 9 | |
Total | .5750 | .21491 | 20 |
Levene's Test of Equality of Error Variancesa,b | ||||||||||||||||||||||||||||||||||||||||||||||||||||||||||||||||||||||||||||
Levene Statistic | df1 | df2 | Sig. | |||||||||||||||||||||||||||||||||||||||||||||||||||||||||||||||||||||||||
Accuracy | Based on Mean | 2.028 | 1 | 16 | .174 | |||||||||||||||||||||||||||||||||||||||||||||||||||||||||||||||||||||||
Based on Median | 2.028 | 1 | 16 | .174 | ||||||||||||||||||||||||||||||||||||||||||||||||||||||||||||||||||||||||
Based on Median and with adjusted df | 2.028 | 1 | 13.245 | .178 | ||||||||||||||||||||||||||||||||||||||||||||||||||||||||||||||||||||||||
Based on trimmed mean | 2.028 | 1 | 16 | .174 | ||||||||||||||||||||||||||||||||||||||||||||||||||||||||||||||||||||||||
Tests the null hypothesis that the error variance of the dependent variable is equal across groups. | ||||||||||||||||||||||||||||||||||||||||||||||||||||||||||||||||||||||||||||
a. Dependent variable: Accuracy b. Design: Intercept + Strategy + Handedness + Strategy * Handedness
| ||||||||||||||||||||||||||||||||||||||||||||||||||||||||||||||||||||||||||||
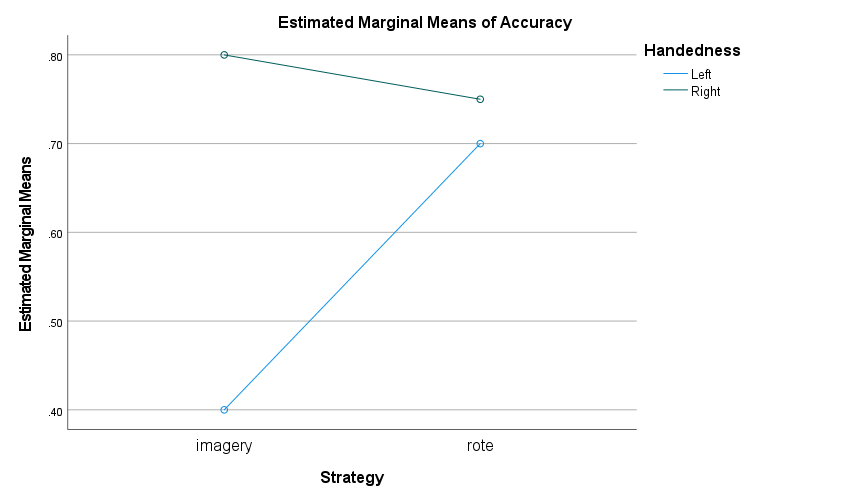 |
Estimated Marginal Means of Accuracy Handedness .80 Left Right .70 .60 Estimated Marginal Means 50 40 imagery rote Strategy
Step by Step Solution
There are 3 Steps involved in it

Get step-by-step solutions from verified subject matter experts