

Question: John, your supervisor asked you to work on a dataset that includes information on a sample of firms in the US and Canada. The dataset
John, your supervisor asked you to work on a dataset that includes information on a sample of firms in the US and Canada. The dataset includes information about firm performance, firm size, and a number of variables related to IT. Specifically, the variables in the dataset are:
- CompanyID: a unique identifier for each company
- NumEmployees: total number of employees
- Country: the firms primary country of operation. If the company has a secondary country of operation, a delimiter is used to separate the primary and secondary countries (US = United States, CA = Canada)
- IT_Outsourcing_REV: the extent to which IT resources have NOT been outsourced to third-party organizations (interval scale: 1-5)
- IT_Efficiency: the extent to which computing resources are effective, scalable, and up to date (interval scale: 1-5)
- FirmPerformance: the performance of the company relative to key competitors (interval scale: 1-5)
You will complete a number of data manipulation and analysis tasks, some of which are discussed and illustrated in the following preparation videos:
- Data Preparation and Example -- available on Module 4. Excel & Data Preparation
- Data Transformation Examples with Excel -- available on Module 5. Excel & Modeling
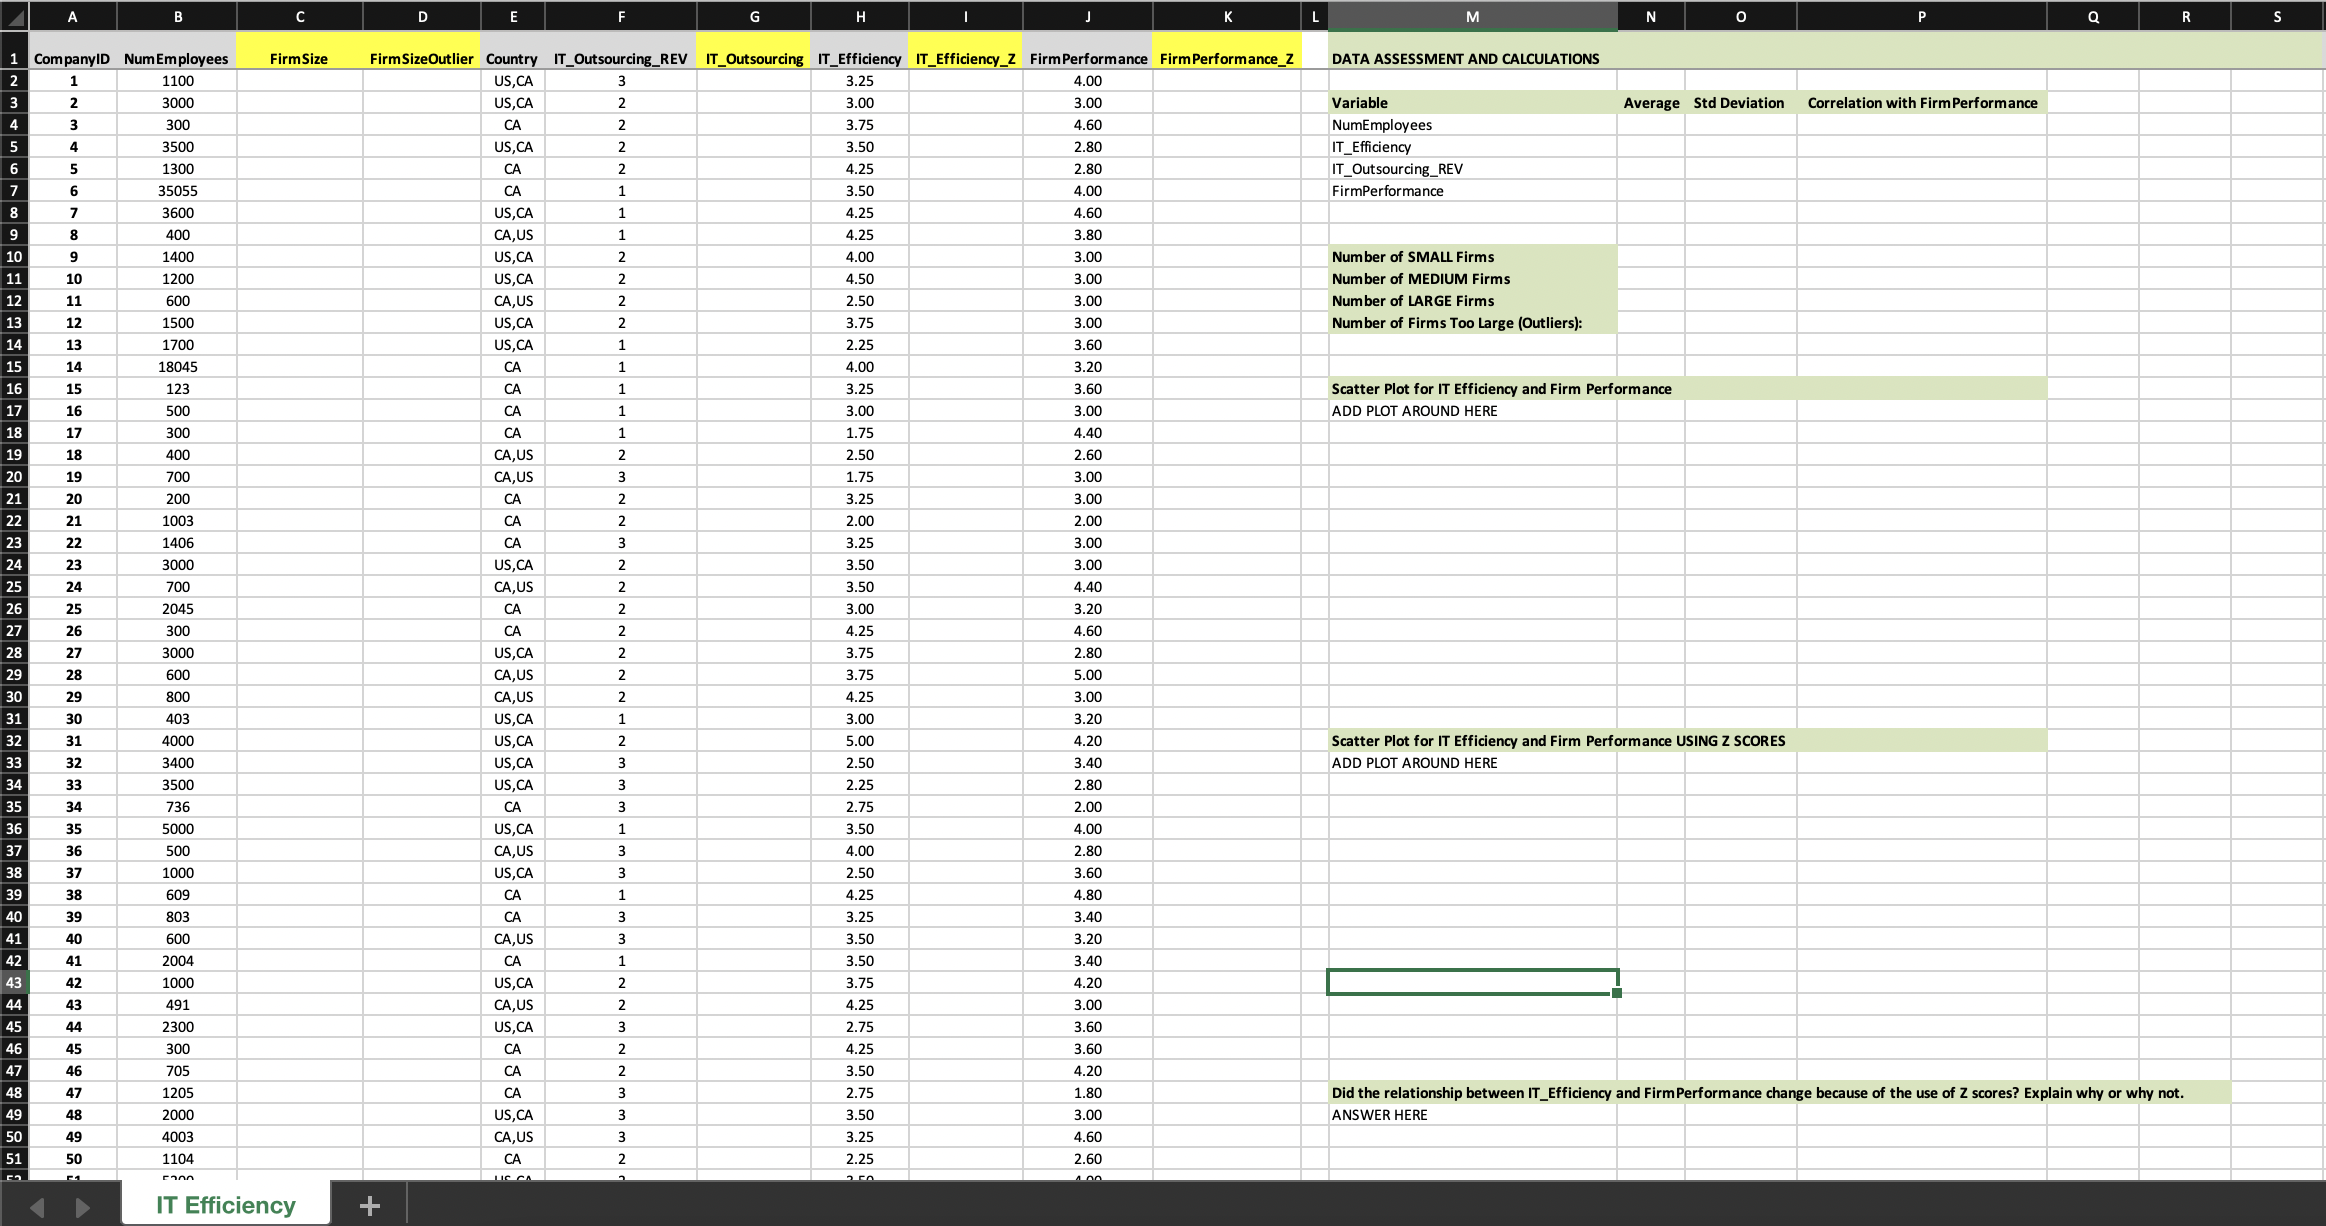
Using the Excel file available here Download Excel file available here, you will complete the following tasks. Note that labels of variables to be populated are highlighted in yellow.
TASK 1: For each one of the variables in Cells M4:M7, calculate the average, standard deviation, and correlation with the variable FirmPerformance;
TASK 2: In Cell C2, use an IF function to create a categorical variable for firm size. The IF function should return the character S for firms whose number of employees is less than 500, M if the firm is larger but number of employees is less than 2000, and L otherwise. Copy your formula down to complete the column;
TASK 3: Your supervisor is concerned that firms that are too large could be outliers and subsequently affect data analysis. You will examine this issue using the variable FirmSizeOutlier. In Cell D2, use an IF function to create a dummy value (1 or 0) that specifies if the firm is an outlier when it comes to number of employees (1=outlier; 0=not an outlier). To make this determination, use the rule of thumb based on mean and standard deviation as discussed on Canvas / Modules / Excel & Data Preparation. Note that you have already calculated mean and standard deviations in TASK 1. Copy your formula down to complete the column;
TASK 4: The variable Country (column E) was created as a multi-purpose field (see variable definition above). Using the Text to Columns Excel feature, break this variable into two variables. The variable Country in column E should retain the same label. The new variable in column F should be titled Country_Secondary (not all firms have a secondary country and some cells will be blank, which is ok). Highlight the label in Cell F1 using yellow fill;
TASK 5: The IT_Outsourcing_REV variable must be reverse-coded to reflect the extent to which IT resources have been outsourced. In Cell H2, use an IF function to perform this data transformation. Copy your formula down to complete the column IT_Outsourcing;
TASK 6: In Column J, create Z scores for the variable IT_Efficiency;
TASK 7: In Column L, create Z scores for the variable FirmPerformance;
TASK 8: In Cells O10:O13, use COUNTIF functions to count the number of small, medium, and large firms in the dataset (use FirmSize for this count), and the number of firms that are outliers (use FirmSizeOutlier for this count).
TASK 9: In Cell N17, create a Scatter Plot for the variables IT_Efficiency (x axis) and FirmPerformance (y axis). Add a trendline (Add Chart Element, Trendline, Linear). Take a look at the chart to understand how one variable changes as the other changes.
TASK 10: In Cell N33, create a Scatter Plot for the variables IT_Efficiency_Z (x axis) and FirmPerformance_Z (y axis). Add a trendline. Then, in Cell N49, answer the following question: Did the relationship between IT Efficiency and Firm Performance change because we visualized the data using Z scores? Explain why or why not.
PLEASE PROVIDE ANSWERS IN EXCEL FUNCTIONS
Step by Step Solution
There are 3 Steps involved in it

Get step-by-step solutions from verified subject matter experts