

Question: Jonathan Je ECON 2105E Summer 2021 Lastrapes Test: Module 1 graded test (What is economics?) This Question: 1 pt 20 of 20 (18 complete) The
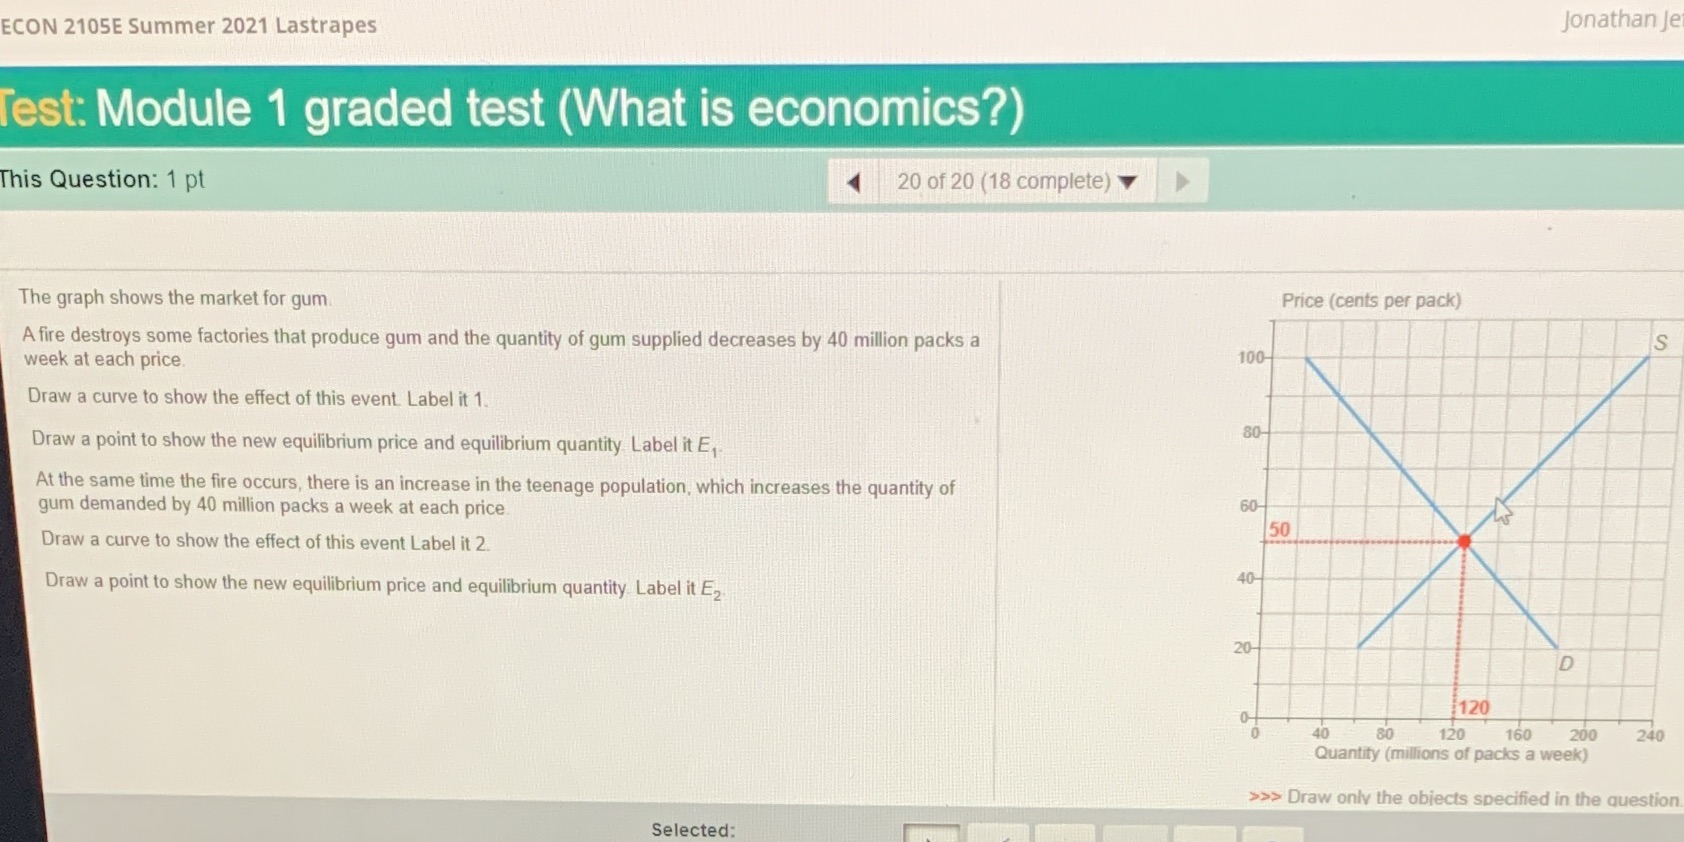
Jonathan Je ECON 2105E Summer 2021 Lastrapes Test: Module 1 graded test (What is economics?) This Question: 1 pt 20 of 20 (18 complete) The graph shows the market for gum Price (cents per pack) A fire destroys some factories that produce gum and the quantity of gum supplied decreases by 40 million packs a S week at each price. 100- Draw a curve to show the effect of this event Label it 1. 80 Draw a point to show the new equilibrium price and equilibrium quantity Label it E, At the same time the fire occurs, there is an increase in the teenage population, which increases the quantity of gum demanded by 40 million packs a week at each price 60- 50 Draw a curve to show the effect of this event Label it 2. 40 Draw a point to show the new equilibrium price and equilibrium quantity Label it Ez 20 D 120 40 80 120 160 200 240 Quantity (millions of packs a week) >>> Draw only the objects specified in the question Selected
Step by Step Solution
There are 3 Steps involved in it

Get step-by-step solutions from verified subject matter experts