

Question: Jou The table below contains data on Fincorp Inc. The balance sheet items correspond to values at year-end 2018 and 2019, while the income statement
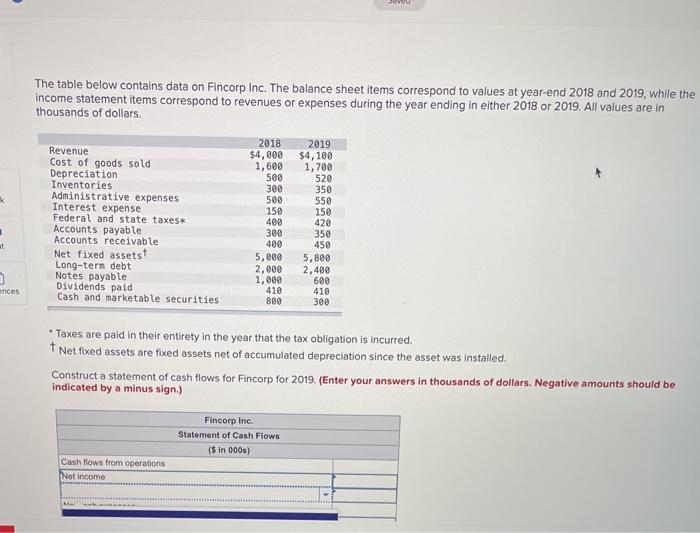
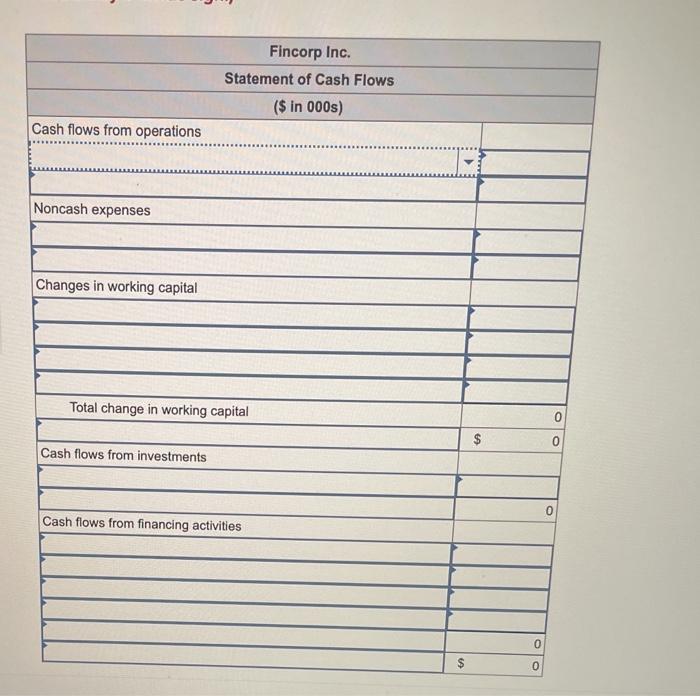
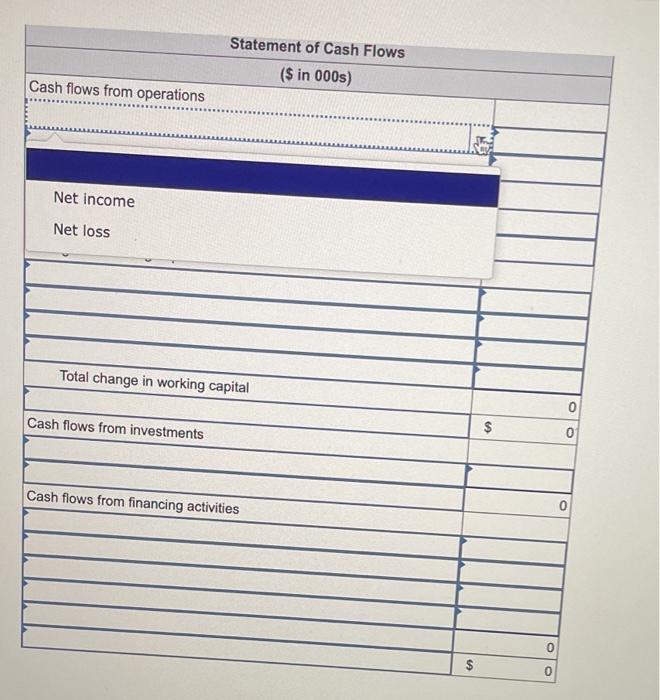
Jou The table below contains data on Fincorp Inc. The balance sheet items correspond to values at year-end 2018 and 2019, while the income statement items correspond to revenues or expenses during the year ending in either 2018 or 2019. All values are in thousands of dollars. 2018 $4,000 1,600 500 300 500 150 400 300 400 5,000 2,000 1,000 Revenue Cost of goods sold Depreciation Inventories Administrative expenses Interest expense Federal and state taxes* Accounts payable Accounts receivable Net fixed assetst Long-term debt Notes payable Dividends paid Cash and marketable securities 2019 $4,100 1,700 520 350 550 150 420 . ut 350 450 5,800 2,400 600 410 300 ences 410 800 . Taxes are paid in their entirety in the year that the tax obligation is incurred. Net fixed assets are fixed assets net of accumulated depreciation since the asset was installed. Construct a statement of cash flows for Fincorp for 2019. (Enter your answers in thousands of dollars. Negative amounts should be indicated by a minus sign.) Fincorp Inc. Statement of Cash Flows (s in 000s) Cash flows from operations Not Income Fincorp Inc. Statement of Cash Flows ($ in 000s) Cash flows from operations Noncash expenses Changes in working capital Total change in working capital 0 $ Cash flows from investments 0 Cash flows from financing activities 0 $ 0 Statement of Cash Flows ($ in 000s) Cash flows from operations Net income Net loss Total change in working capital 0 Cash flows from investments $ 0 Cash flows from financing activities 0 $
Step by Step Solution
There are 3 Steps involved in it

Get step-by-step solutions from verified subject matter experts