

Question: Return Submit 2 10 points The table below contains data on Fincorp Inc. The balance sheet items correspond to values at year end 2018 and
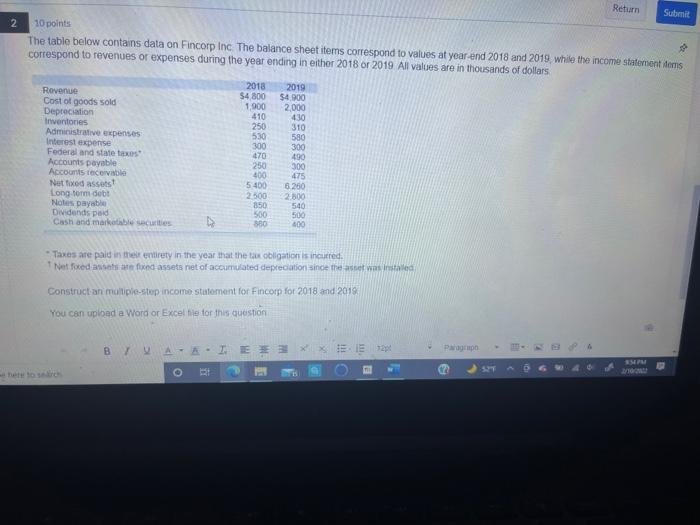
Return Submit 2 10 points The table below contains data on Fincorp Inc. The balance sheet items correspond to values at year end 2018 and 2019, while the income statement des correspond to revenues or expenses during the year ending in either 2018 or 2019 All values are in thousands of dollars 2018 4800 1,900 410 Revenue Cost of goods sold Depreciation Inventories Administrative expenses Interest expense Federal and state taxes Accounts payable Accounts receivable Net fixed assetst Longorm dobi Notes payable Dividends pad Cash and marketable securities 250 530 300 470 250 400 5400 2500 850 500 2019 $4900 2,000 430 310 580 300 490 300 475 6.250 2.000 540 500 400 180 Taxes are paid in the entirety in the year that the ta obligation is incurred. Net foxed assau fixed assets niet of accumulated depreciation since the set was installed Construct an moltiple-step income statement for Fincorp for 2018 and 2018 You can upload a Word or Excelle for this question AA. IEEE Palopo EM
Step by Step Solution
There are 3 Steps involved in it

Get step-by-step solutions from verified subject matter experts