

Question: Jump to level 1 The scatter plot shows the relationship between the number of coffee drinks sold and the total expenses of a coffee 2
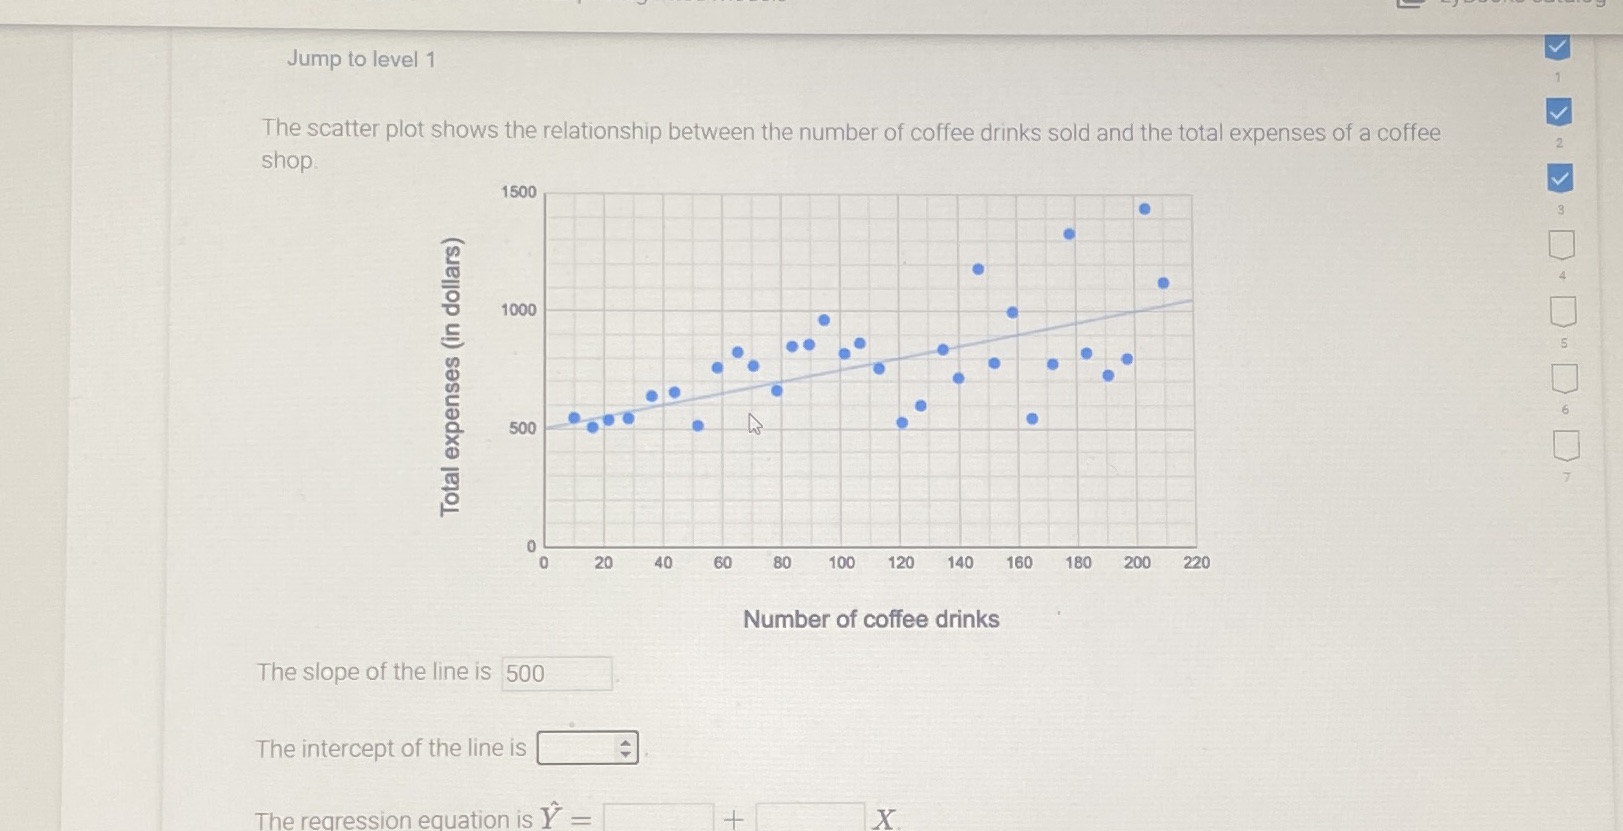
Jump to level 1 The scatter plot shows the relationship between the number of coffee drinks sold and the total expenses of a coffee 2 shop 1500 3 4 1000 5 Total expenses (in dollars) 500 20 40 60 80 100 120 140 160 180 200 220 Number of coffee drinks The slope of the line is 500 The intercept of the line is + The regression equation is Y
Step by Step Solution
There are 3 Steps involved in it
1 Expert Approved Answer
Step: 1 Unlock

Question Has Been Solved by an Expert!
Get step-by-step solutions from verified subject matter experts
Step: 2 Unlock
Step: 3 Unlock