

Question: The scatter plot shows the relationship between the number of coffee drinks sold and the total expenses of a coffee shop. Total expenses (in
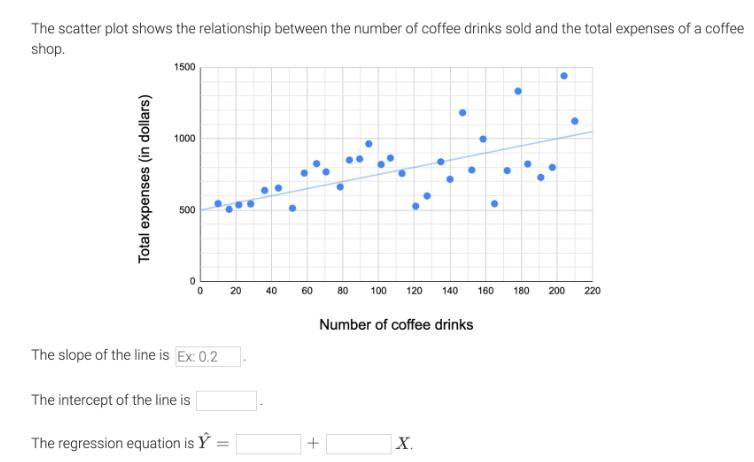
The scatter plot shows the relationship between the number of coffee drinks sold and the total expenses of a coffee shop. Total expenses (in dollars) 1500 1000 500 The slope of the line is Ex: 0.2 The intercept of the line is The regression equation is 20 40 10 220 60 80 100 120 + 140 160 180 200 220 Number of coffee drinks X.
Step by Step Solution
There are 3 Steps involved in it
1 Expert Approved Answer
Step: 1 Unlock

Question Has Been Solved by an Expert!
Get step-by-step solutions from verified subject matter experts
Step: 2 Unlock
Step: 3 Unlock