

Question: Just analyze and explain charts and also explain the chi charts of RACE and GUN LAW and also OWNGUN and GUN LAW. charts below Case
Just analyze and explain charts and also
explain the chi charts of RACE and GUN LAW
and also OWNGUN and GUN LAW.
charts below
Case Processing Summary | ||||||
Cases | ||||||
Valid | Missing | Total | ||||
N | Percent | N | Percent | N | Percent | |
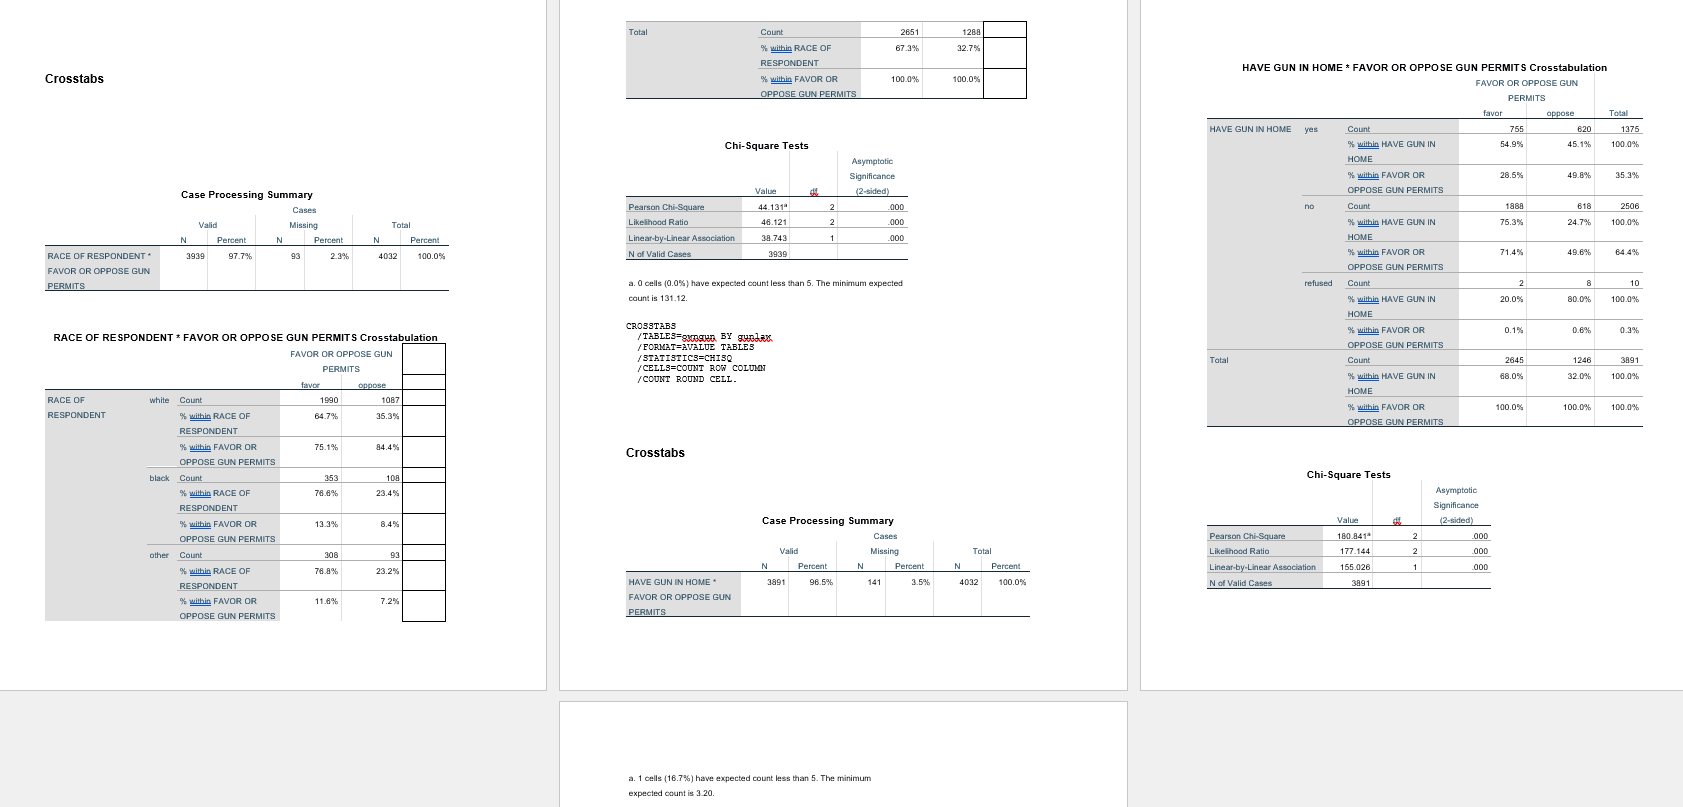
RACE OF RESPONDENT * FAVOR OR OPPOSE GUN PERMITS | 3939 | 97.7% | 93 | 2.3% | 4032 | 100.0% |
RACE OF RESPONDENT * FAVOR OR OPPOSE GUN PERMITS Crosstabulation | |||||
FAVOR OR OPPOSE GUN PERMITS | |||||
favor | oppose | ||||
RACE OF RESPONDENT | white | Count | 1990 | 1087 | |
% within RACE OF RESPONDENT | 64.7% | 35.3% | |||
% within FAVOR OR OPPOSE GUN PERMITS | 75.1% | 84.4% | |||
black | Count | 353 | 108 | ||
% within RACE OF RESPONDENT | 76.6% | 23.4% | |||
% within FAVOR OR OPPOSE GUN PERMITS | 13.3% | 8.4% | |||
other | Count | 308 | 93 | ||
% within RACE OF RESPONDENT | 76.8% | 23.2% | |||
% within FAVOR OR OPPOSE GUN PERMITS | 11.6% | 7.2% | |||
Total | Count | 2651 | 1288 | ||
% within RACE OF RESPONDENT | 67.3% | 32.7% | |||
% within FAVOR OR OPPOSE GUN PERMITS | 100.0% | 100.0% |
Chi-Square Tests | |||
Value | df | Asymptotic Significance (2-sided) | |
Pearson Chi-Square | 44.131a | 2 | .000 |
Likelihood Ratio | 46.121 | 2 | .000 |
Linear-by-Linear Association | 38.743 | 1 | .000 |
N of Valid Cases | 3939 |
a. 0 cells (0.0%) have expected count less than 5. The minimum expected count is 131.12. |
Case Processing Summary | ||||||
Cases | ||||||
Valid | Missing | Total | ||||
N | Percent | N | Percent | N | Percent | |
HAVE GUN IN HOME * FAVOR OR OPPOSE GUN PERMITS | 3891 | 96.5% | 141 | 3.5% | 4032 | 100.0% |
HAVE GUN IN HOME * FAVOR OR OPPOSE GUN PERMITS Crosstabulation | |||||
FAVOR OR OPPOSE GUN PERMITS | Total | ||||
favor | oppose | ||||
HAVE GUN IN HOME | yes | Count | 755 | 620 | 1375 |
% within HAVE GUN IN HOME | 54.9% | 45.1% | 100.0% | ||
% within FAVOR OR OPPOSE GUN PERMITS | 28.5% | 49.8% | 35.3% | ||
no | Count | 1888 | 618 | 2506 | |
% within HAVE GUN IN HOME | 75.3% | 24.7% | 100.0% | ||
% within FAVOR OR OPPOSE GUN PERMITS | 71.4% | 49.6% | 64.4% | ||
refused | Count | 2 | 8 | 10 | |
% within HAVE GUN IN HOME | 20.0% | 80.0% | 100.0% | ||
% within FAVOR OR OPPOSE GUN PERMITS | 0.1% | 0.6% | 0.3% | ||
Total | Count | 2645 | 1246 | 3891 | |
% within HAVE GUN IN HOME | 68.0% | 32.0% | 100.0% | ||
% within FAVOR OR OPPOSE GUN PERMITS | 100.0% | 100.0% | 100.0% |
Chi-Square Tests | |||
Value | df | Asymptotic Significance (2-sided) | |
Pearson Chi-Square | 180.841a | 2 | .000 |
Likelihood Ratio | 177.144 | 2 | .000 |
Linear-by-Linear Association | 155.026 | 1 | .000 |
N of Valid Cases | 3891 |
a. 1 cells (16.7%) have expected count less than 5. The minimum expected count is 3.20. |
Total Count 2651 1288 % within RACE OF 67.3% 32.7%% RESPONDENT HAVE GUN IN HOME * FAVOR OR OPPOSE GUN PERMITS Crosstabulation Crosstabs %% within FAVOR OR 100.0% 100.0% FAVOR OR OPPOSE GUN OPPOSE GUN PERMITS PERMITS favor appose Total HAVE GUN IN HOME yes Count 765 620 1375 Chi-Square Tests % within HAVE GUN IN 54.9% 45.1% 100.0% Asymptotic HOME Significance % within FAVOR OR 28.5% 49.8% 35.3% Case Processing Summary Value (2-sided) OPPOSE GUN PERMITS Cases Pearson Chi-Square 44.131" -000 no Count 1888 618 2506 Valid Missing Total Likelihood Ratio 18.121 .000 % within HAVE GUN IN 75.3% 24.7% 100.09 N Percent Percent N Percent Linear-by-Linear Association 38.743 .000 HOME RACE OF RESPONDENT . 1939 97.7% 2.3% 4032 100.0% N of Valid Cases 3939 % within FAVOR OR 71.49% 49.6% 84.4% FAVOR OR OPPOSE GUN OPPOSE GUN PERMITS PERMITS a. 0 cells (0.0%) have expected count less than 5. The minimum expected refused Count 8 10 count is 131.12. % within HAVE GUN IN 20.0% 80.0% 100.0% HOME CROSSTABS % within FAVOR OR 0.1% 0.6% 0.3% RACE OF RESPONDENT * FAVOR OR OPPOSE GUN PERMITS Crosstabulation /TABLES=gwogun BY gunlex /FORMAT=AVALUE TABLES OPPOSE GUN PERMITS FAVOR OR OPPOSE GUN STATISTICS=CHISQ Total Count 2645 1246 3891 PERMITS /CELLS=COUNT ROW COLUMN /COUNT ROUND CELL. within HAVE GUN IN 88.09% 32.0% 100.09 favor oppose HOME RACE OF white Count 1990 1087 % within FAVOR OR 100.0% 100.0% 100.09 RESPONDENT * within RACE OF 64.7% 35.35 OPPOSE GUN PERMITS RESPONDENT within FAVOR OR 75.1% 84.4% Crosstabs OPPOSE GUN PERMITS black Count 353 108 Chi-Square Tests % within RACE OF 76.6% 23.4% Asymptotic RESPONDENT Significance * within FAVOR OR 13.3% 8.45% Case Processing Summary Value (2-sided) OPPOSE GUN PERMITS Cases Pearson Chi-Square 180.841* 2 1000 other Count Total 308 93 Valid Missing Likelihood Ratio 177.144 N 000 % within RACE OF 76.8% 23.29 N Percent N Percent Percent Linear-by-Linear Association 155.026 000 RESPONDENT HAVE GUN IN HOME . 3891 96.5% 141 3.5% 4032 100.0% N of Valid Cases 3891 within FAVOR OR 11.6% 7.25% FAVOR OR OPPOSE GUN OPPOSE GUN PERMITS PERMITS a. 1 cells (16.7%) have expected count less than 5. The minimum expected count is 3.20
Step by Step Solution
There are 3 Steps involved in it

Get step-by-step solutions from verified subject matter experts