

Question: JUST ANSWER THE MULTI CHOICE NO FURTHER explanation NEEDED JUST ANSWER WITH LETTER PLEASE 1. Multiple choice A statistics student made the following grades on

JUST ANSWER THE MULTI CHOICE NO FURTHER explanation NEEDED JUST ANSWER WITH LETTER PLEASE
1.
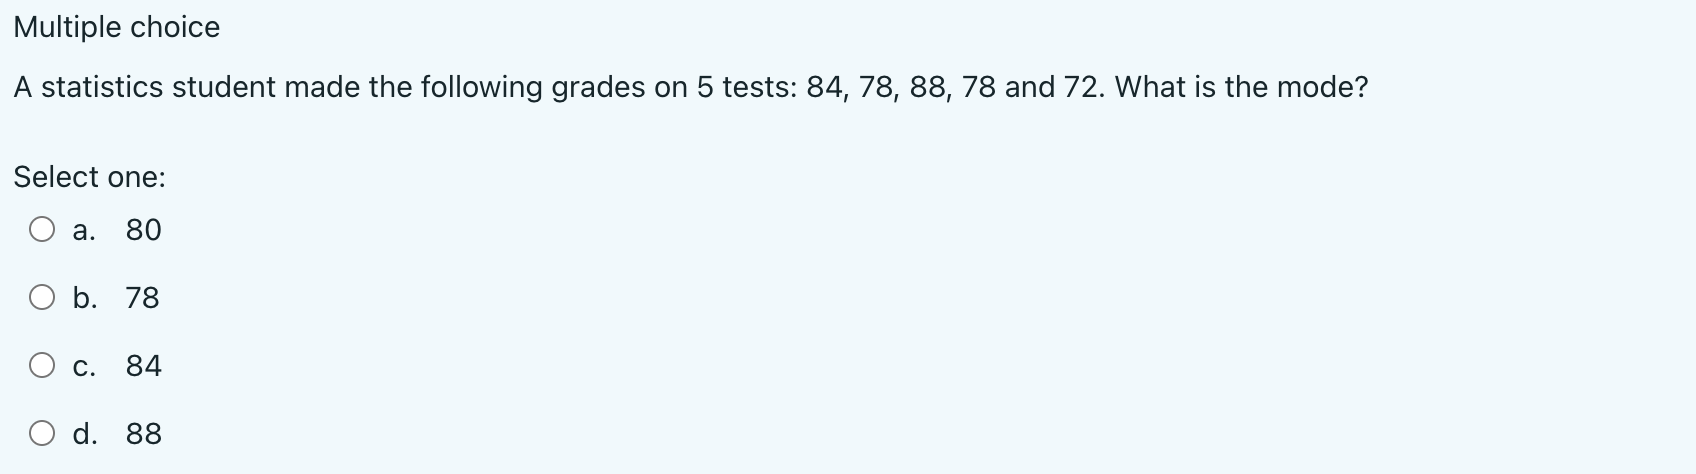
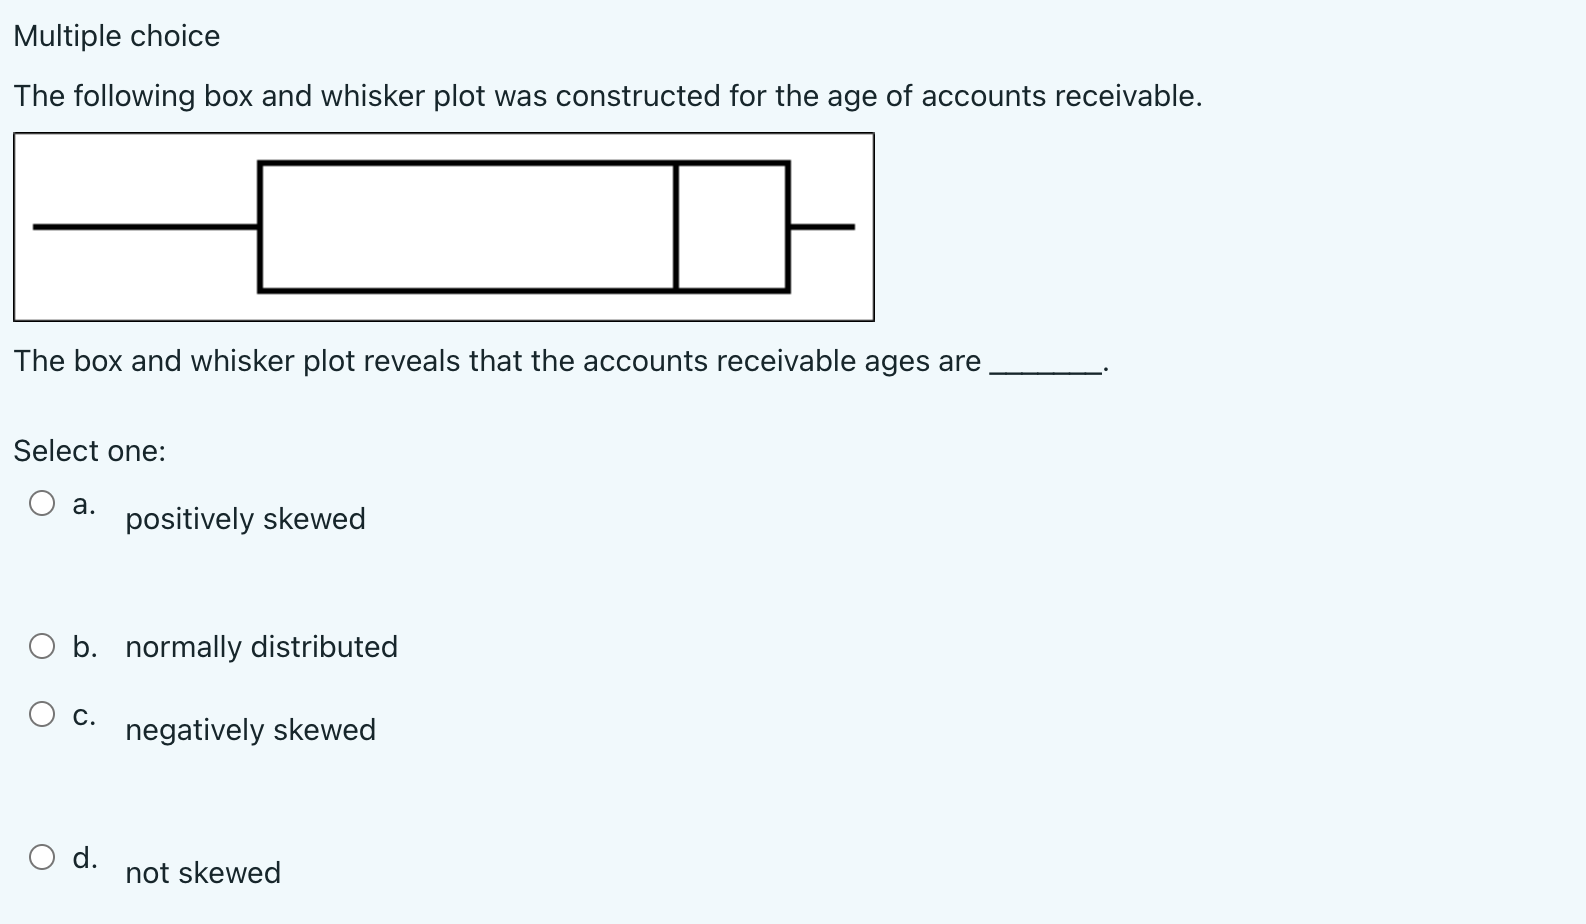
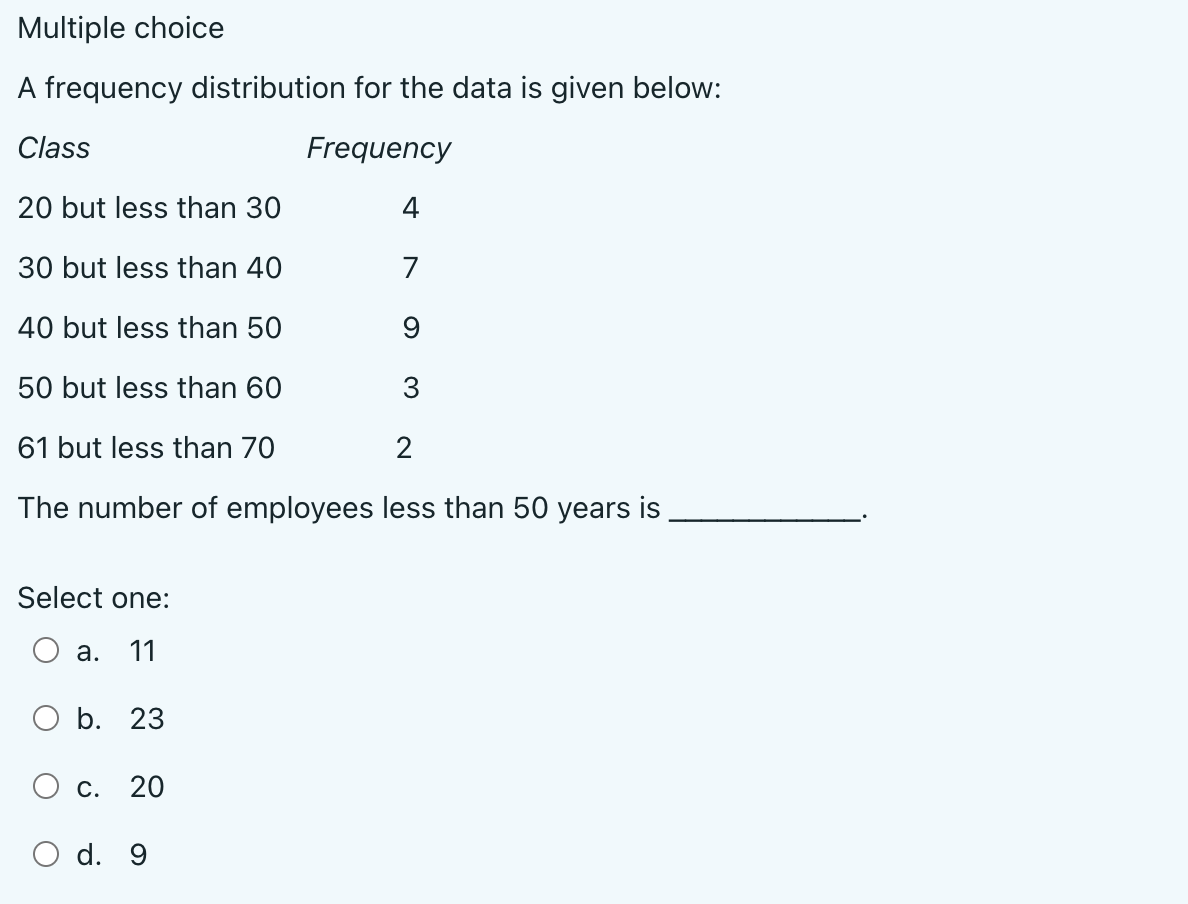
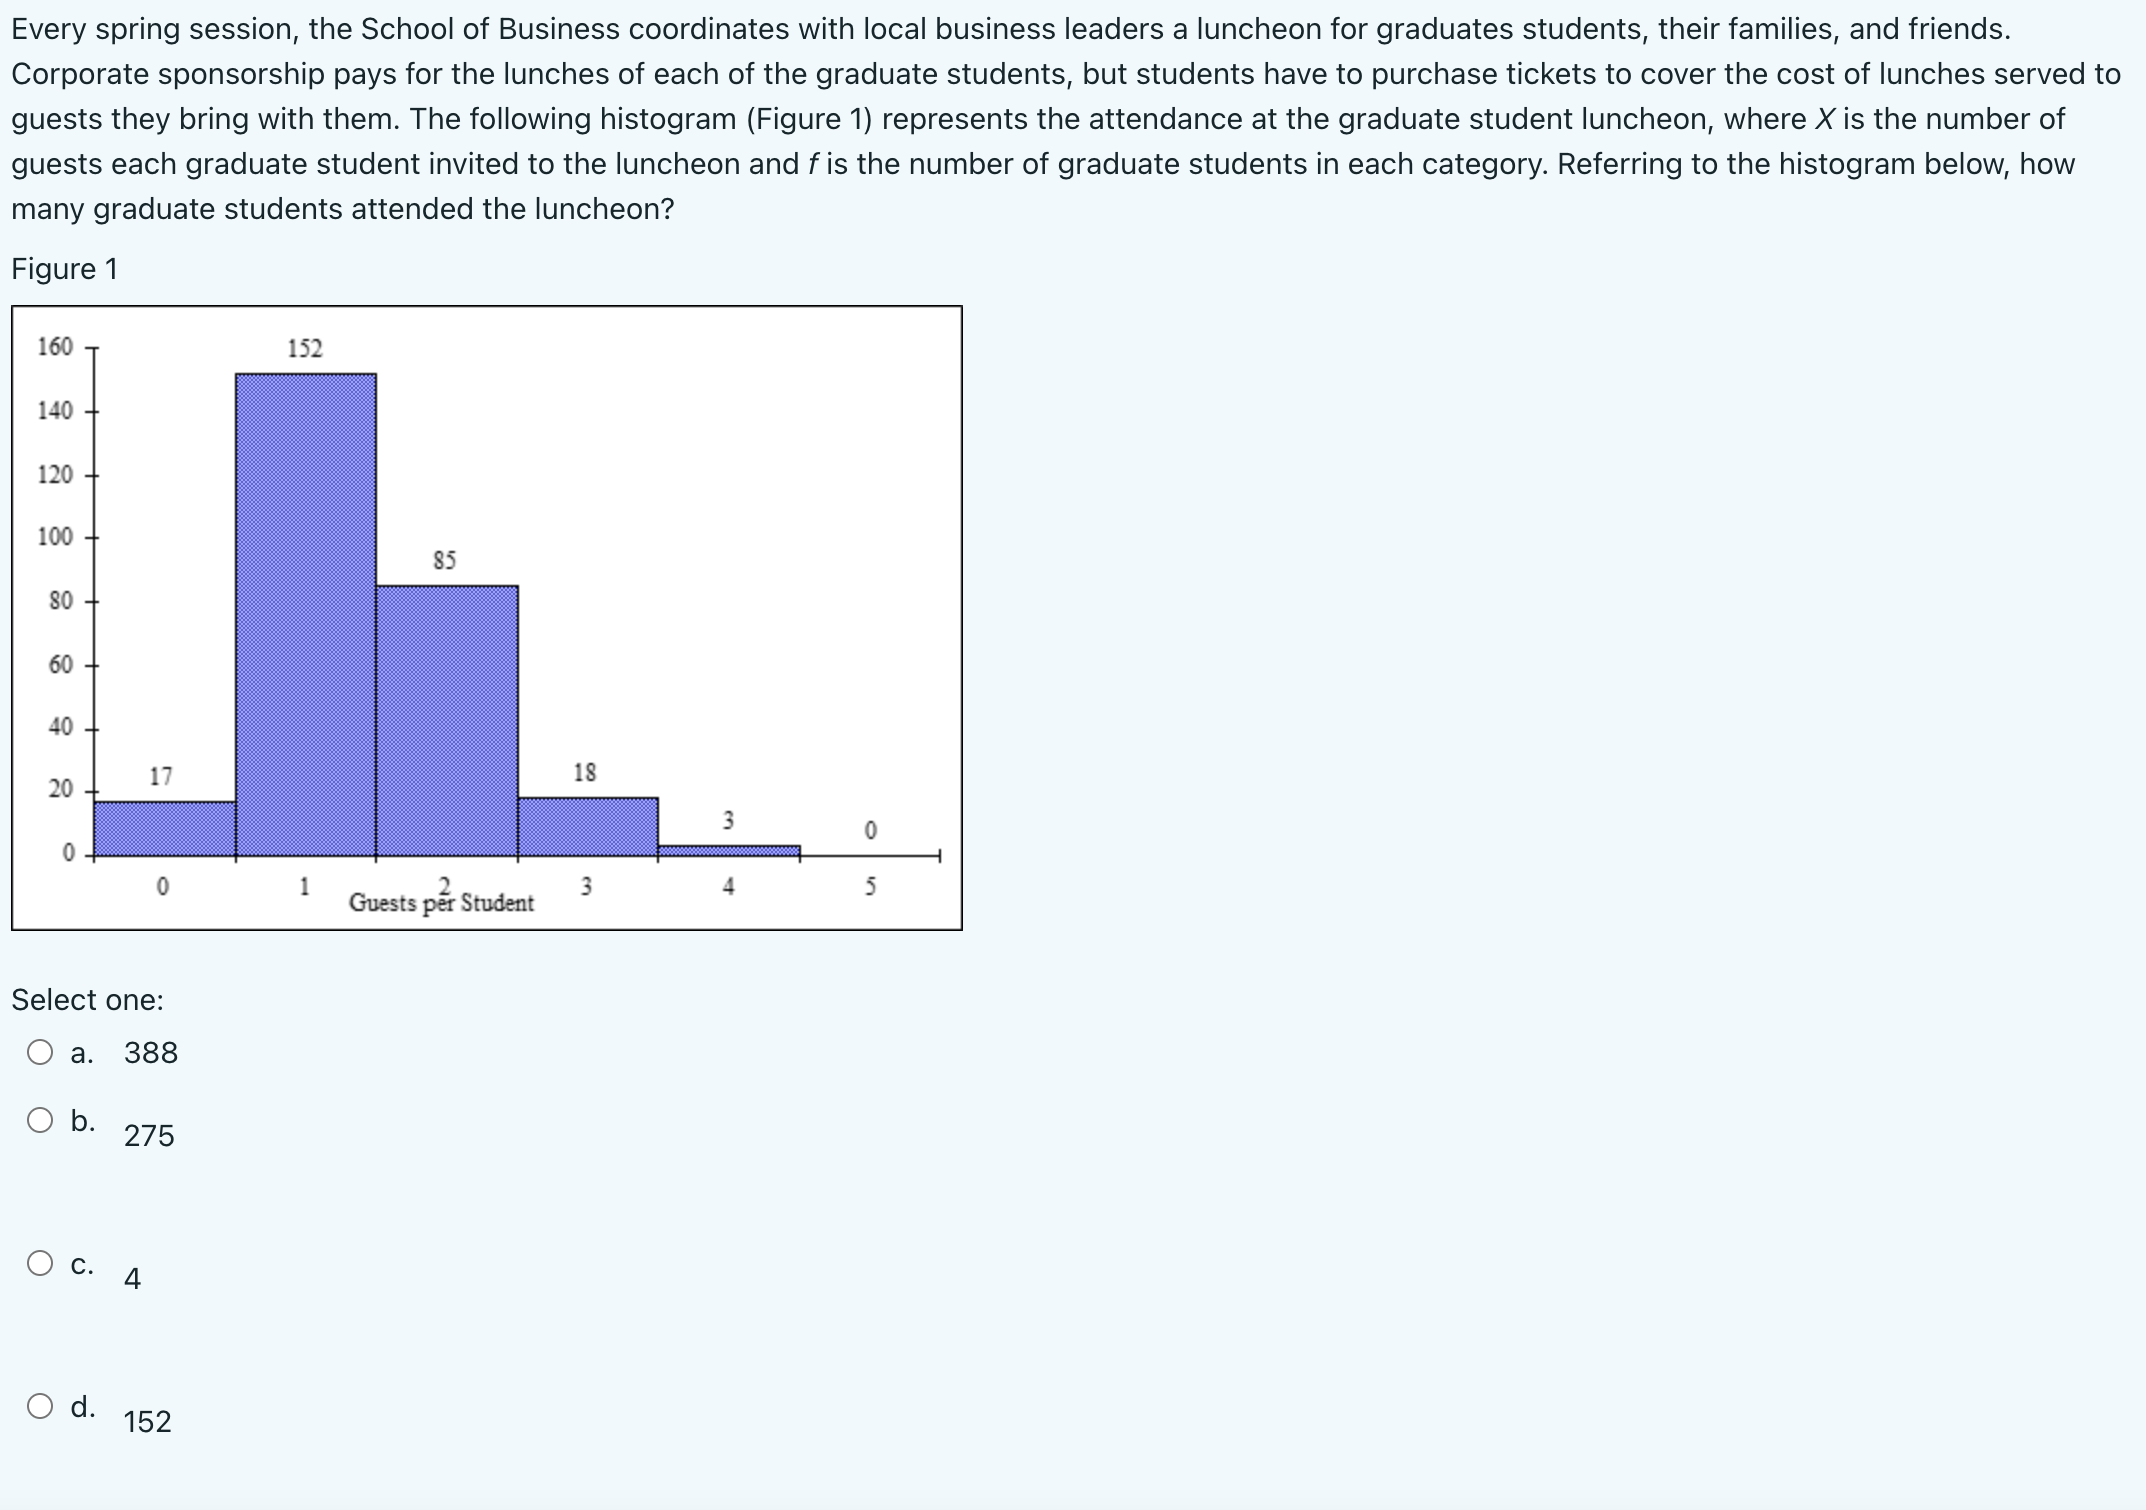
Multiple choice A statistics student made the following grades on 5 tests: 84, 78, 88, 78 and 72. What is the mode? Select one: 0 a. 80 O b. 78 O c. 84 Q d. 88 Multiple choice The following box and whisker plot was constructed for the age of accounts receivable. The box and whisker plot reveals that the accounts receivable ages are Select one: O a. positively skewed O b. normally distributed O C. negatively skewed O d. not skewedMultiple choice A frequency distribution for the data is given below: Class Frequency 20 but less than 30 4 30 but less than 40 7 40 but less than 50 9 50 but less than 60 3 61 but less than 70 2 The number of employees less than 50 years is Select one: 0 a. 11 O b. 23 O c. 20 Every spring session, the School of Business coordinates with local business leaders a luncheon for graduates students, their families, and friends. Corporate sponsorship pays for the lunches of each of the graduate students, but students have to purchase tickets to cover the cost of lunches served to guests they bring with them. The following histogram (Figure 1) represents the attendance at the graduate student luncheon, where X is the number of guests each graduate student invited to the luncheon and f is the number of graduate students in each category. Referring to the histogram below, how many graduate students attended the luncheon? Figure 'I Select one: Q a. 388 O b. 275 O c. 4 Q d. 152 Which of the following is not a measure of central tendency? Select one: 0 a. range 0 b. mean 0 (2. mode 0 d. median
Step by Step Solution
There are 3 Steps involved in it

Get step-by-step solutions from verified subject matter experts