

Question: Just answer the question simply is that UNIT 2. SUMMARIZING DATA GRAPHICALLY AND NUMERICALLY 2. These histograms show the budget in millions of dollars for
Just answer the question simply is that
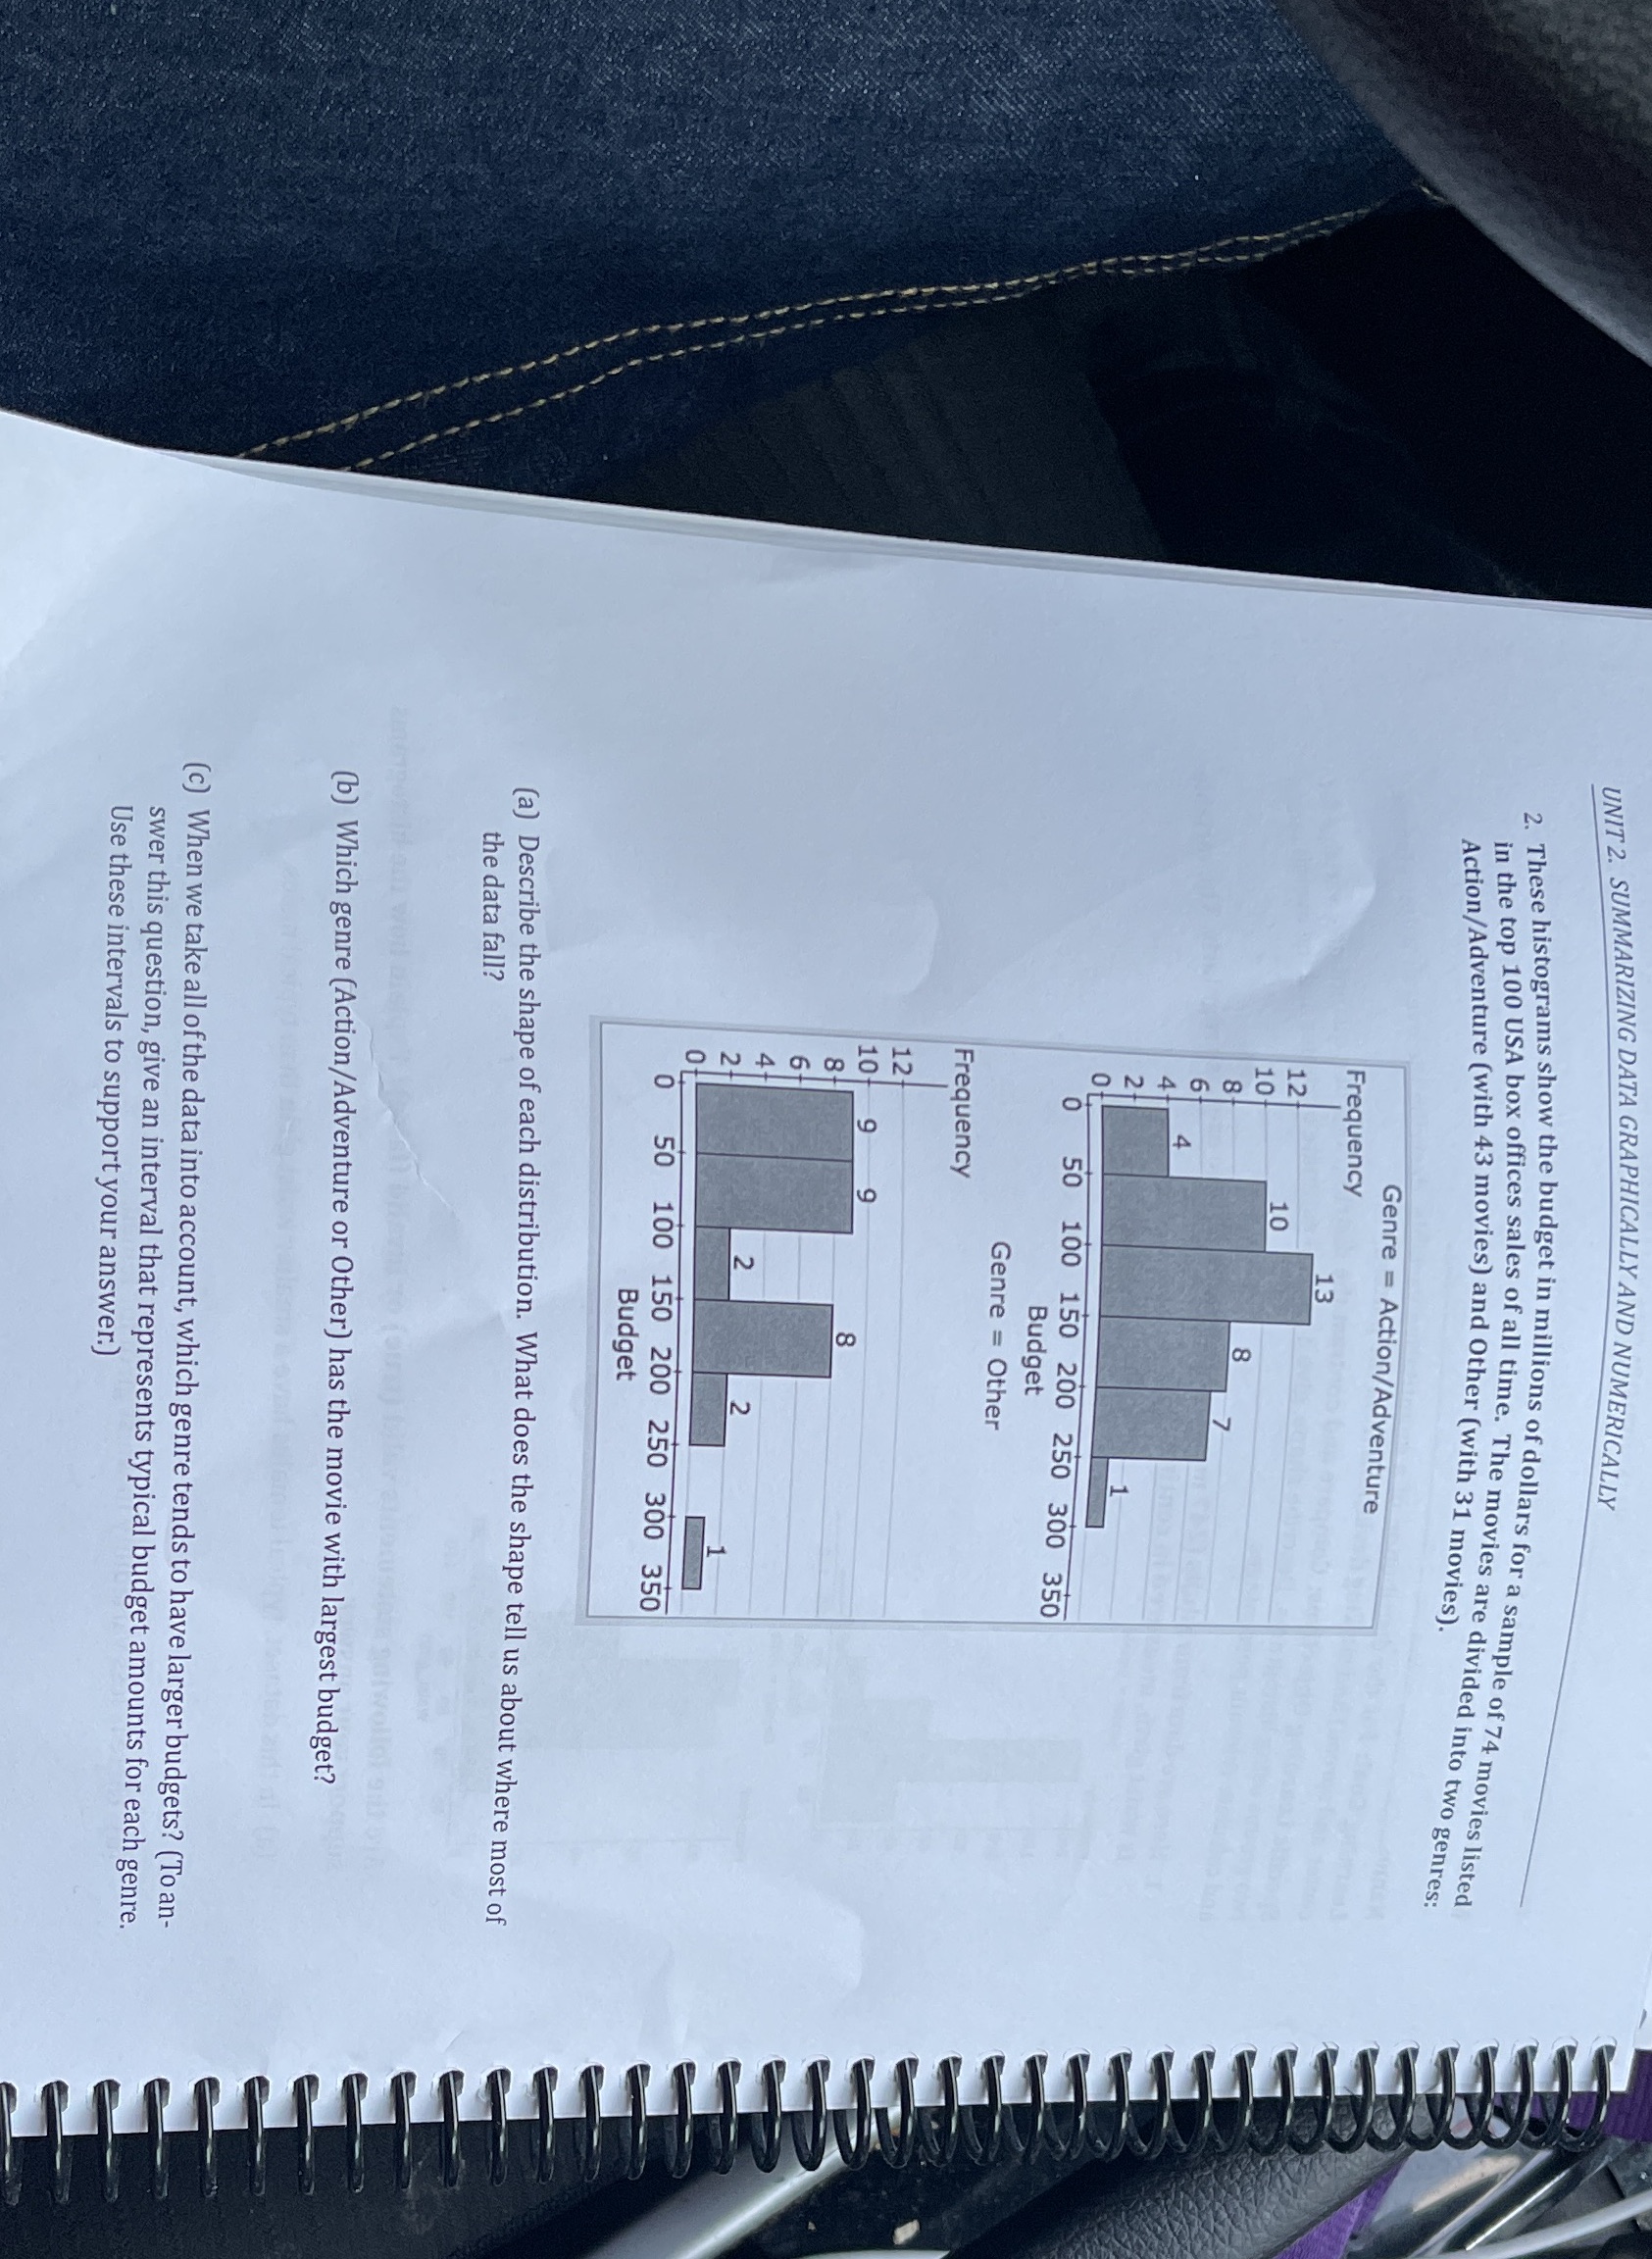
UNIT 2. SUMMARIZING DATA GRAPHICALLY AND NUMERICALLY 2. These histograms show the budget in millions of dollars for a sample of 74 movies listed in the top 100 USA box offices sales of all time. The movies are divided into two genres: Action/Adventure (with 43 movies) and Other (with 31 movies). Genre = Action/Adventure Frequency 13 10 10 4 50 100 150 200 250 300 350 Budget Genre = Other Frequency 10 50 100 150 200 250 300 350 Budget (a) Describe the shape of each distribution. What does the shape tell us about where most of the data fall ? (b) Which genre (Action/Adventure or Other) has the movie with largest budget? (c) When we take all of the data into account, which genre tends to have larger budgets? (To an- swer this question, give an interval that represents typical budget amounts for each genre. Use these intervals to support your answer.)
Step by Step Solution
There are 3 Steps involved in it

Get step-by-step solutions from verified subject matter experts