

Question: just c and d please The data in the table represent the number of drivers involved in fatal crashes in a certain region by day
just c and d please
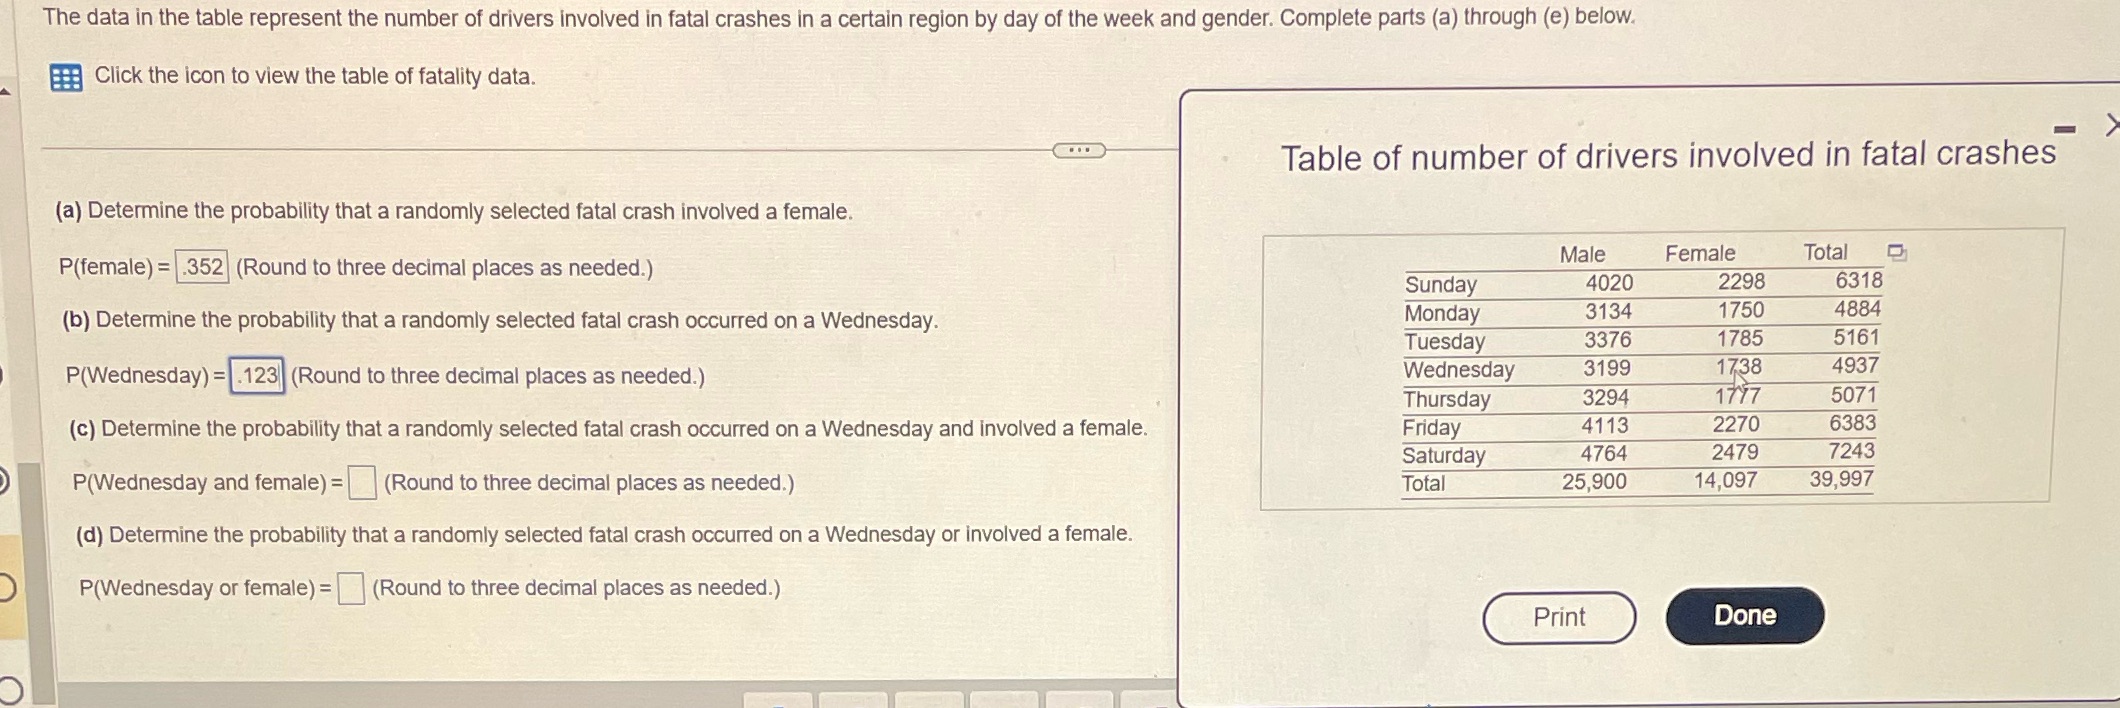
The data in the table represent the number of drivers involved in fatal crashes in a certain region by day of the week and gender. Complete parts (a) through (e) below. Click the icon to view the table of fatality data. Table of number of drivers involved in fatal crashes (a) Determine the probability that a randomly selected fatal crash involved a female. P(female) = .352 (Round to three decimal places as needed.) Male Female Total Sunday 4020 2298 6318 (b) Determine the probability that a randomly selected fatal crash occurred on a Wednesday. Monday 3134 1750 4884 Tuesday 3376 1785 5161 P(Wednesday) = 123| (Round to three decimal places as needed.) Wednesday 3199 1738 4937 Thursday 3294 1797 5071 (c) Determine the probability that a randomly selected fatal crash occurred on a Wednesday and involved a female. Friday 4113 2270 6383 Saturday 4764 2479 7243 P(Wednesday and female) = (Round to three decimal places as needed.) Total 25,900 14,097 39,997 (d) Determine the probability that a randomly selected fatal crash occurred on a Wednesday or involved a female. P(Wednesday or female) = (Round to three decimal places as needed.) Print Done
Step by Step Solution
There are 3 Steps involved in it

Get step-by-step solutions from verified subject matter experts