

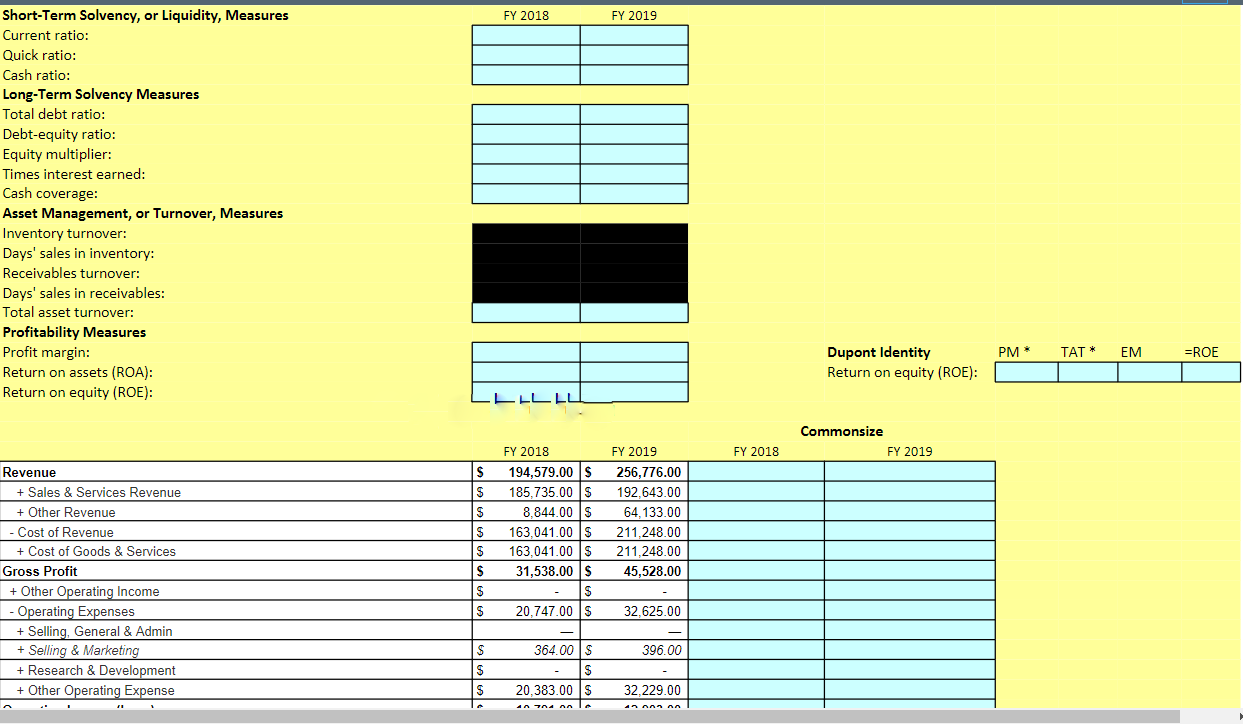
Question: just find ratios in the blue dont do commonsize FY 2018 FY 2019 Short-Term Solvency, or Liquidity, Measures Current ratio: Quick ratio: Cash ratio: Long-Term
just find ratios in the blue dont do commonsize
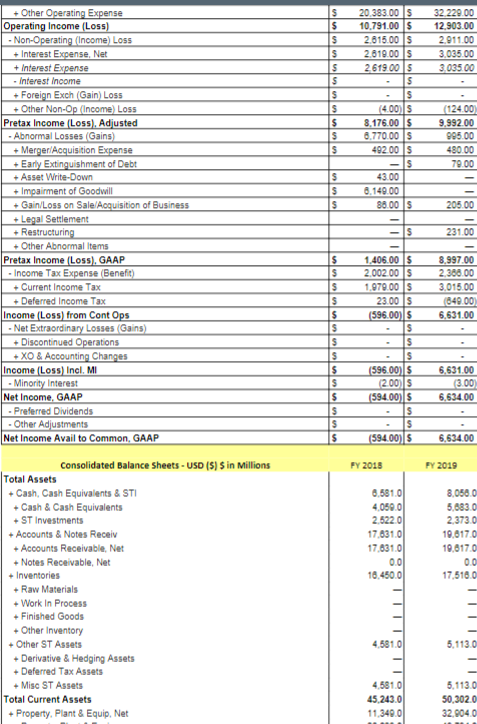
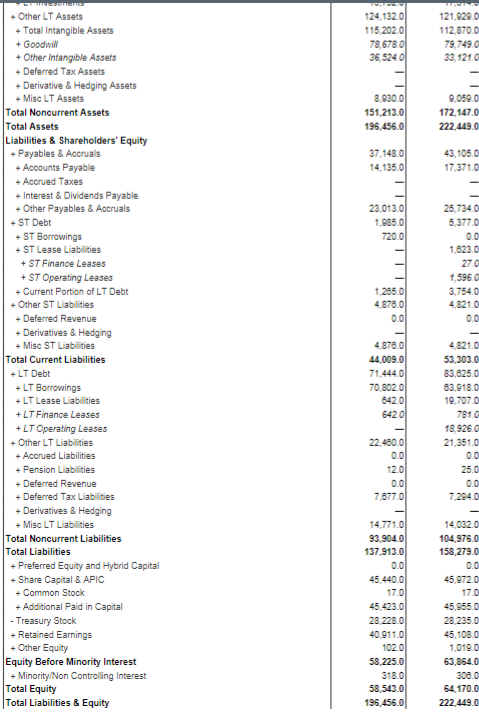
FY 2018 FY 2019 Short-Term Solvency, or Liquidity, Measures Current ratio: Quick ratio: Cash ratio: Long-Term Solvency Measures Total debt ratio: Debt-equity ratio: Equity multiplier: Times interest earned: Cash coverage: Asset Management, or Turnover, Measures Inventory turnover: Days' sales in inventory: Receivables turnover: Days' sales in receivables: Total asset turnover: Profitability Measures Profit margin: Return on assets (ROA): Return on equity (ROE): PM TAT * EM =ROE Dupont Identity Return on equity (ROE): LLLLL Commonsize FY 2019 FY 2018 $ FY 2018 194,579.00 S 185,735.00 $ 8.844.00 $ 163,041.00 S 163,041.00 $ 31,538.00 S S $ $ S S $ $ FY 2019 256,776.00 192,643.00 64,133.00 211,248.00 211,248.00 45,528.00 Revenue + Sales & Services Revenue + Other Revenue - Cost of Revenue + Cost of Goods & Services Gross Profit + Other Operating Income - Operating Expenses + Selling, General & Admin + Selling & Marketing + Research & Development + Other Operating Expense 20.747.00 $ 32.625.00 $ 364.00 $ 396.00 $ $ 20,383.00 32.229.00 anoon on 32 229.00 12.903.00 2.911.00 3.035.00 3.035.00 $ $ $ $ $ $ $ $ $ S $ + 20.383.00 $ 10.791.00 ls 2.815.00 $ 2.819.00 $ 2619.00 $ $ $ (4.00) 8.176.00 $ 0.770.00 $ 49200 S $ 43.00 6.149.00 88.00 (124.00 9,992.00 995.00 480.00 79.00 S $ $ 205.00 - $ 231.00 8.997.00 2.388.00 3.015.00 (649.00 6.631.00 + Other Operating Expense Operating Income (Loss) - Non-Operating (Income) Loss +Interest Expense, Net + Interest Expense - Interest Income +Foreign Exch (Gain) Loss + Other Non-Op (Income) Loss Pretax Income (Loss). Adjusted - Abnormal Losses (Gains) + Merger/Acquisition Expense + Early Extinguishment of Debt + Asset Write-Down + Impairment of Goodwill + Gain Loss on Sale Acquisition of Business Legal Settlement Restructuring + Other Abnormal Items Pretax Income (Loss), GAAP - Income Tax Expense (Benefit) Current Income Tax Deferred Income Tax Income (Loss) from Cont Ops - Net Extraordinary Losses (Gains) + Discontinued Operations + XO & Accounting Changes Income (Loss) Incl. MI - Minority interest Net Income, GAAP - Preferred Dividends Other Adjustments Net Income Avail to Common, GAAP Consolidated Balance Sheets - USD (S) Sin Millions Total Assets + Cash Cash Equivalents & STI + Cash & Cash Equivalents + ST Investments + Accounts & Notes Receiv + Accounts Receivable, Net + Notes Receivable, Net +Inventories +Raw Materials + Work In Process + Finished Goods + Other Inventory Other ST Assets + Derivative & Hedging Assets + Deferred Tax Assets + Misc ST Assets Total Current Assets + Property, Plant & Equip, Net $ $ $ $ $ $ S $ $ S $ $ S $ 1.406.00 $ 2.002.00 $ 1.979.00 $ 23 00 $ (596.00 $ $ $ $ (596.00 $ (2005 (594.00 $ $ $ (594.00) $ 6.631.00 (3.00 6.634.00 6.634.00 FY 2018 FY 2019 0.581.0 4,050.00 2.5220 17,631.0 17,631.01 0.01 16.450.00 8,058.0 5.883.0 2.373.0 19,617.0 19,617.0 0.0 17,516,0 4.581.00 5.113.0 4.581.0 45.243.0 11,340.0 5.113.0 50,302.0 32.904.0 124 1320 115.2020 78,67801 36,524.0 121,9290 112.8700 79 749.0 33, 121.0 8,930.0 151,213.0 196.456.0 9,0590 172.147.0 222.449.0 37.148.00 14. 135.0 43,1050 17,3710 23.013.0 1.985.0 720.0 25.734.0 5,377.0 0.0 1,623.0 27.0 1,5960 3.7540 4.821.0 0.0 1.285.0 48780 0.0 + Other LT Assets + Total Intangible Assets + Goodwill + Other Intangible Assets + Deferred Tax Assets Derivative & Hedging Assets + Misc LT Assets Total Noncurrent Assets Total Assets Liabilities & Shareholders' Equity +Payables & Accruals + Accounts Payable + Accrued Taxes + Interest & Dividends Payable + Other Payables & Accruals + ST Debt +ST Borrowings +ST Lease Liabilities + ST Finance Leases + ST Operating Leases + Current Portion of LT Debt + Other ST Liabilities + Deferred Revenue + Derivatives & Hedging + Misc ST Liabilities Total Current Liabilities +LT Debt +LT Borrowings +LT Lease Liabilities +LT Finance Leases +LT Operating Leases + Other LT Liabilities + Accrued Liabilities Pension Liabilities Deferred Revenue Deferred Tax Liabilities + Derivatives & Hedging Misc LT Liabilities Total Noncurrent Liabilities Total Liabilities + Preferred Equity and Hybrid Capital + Share Capital & APIC + Common Stock + Additional Paid in Capital - Treasury Stock +Retained Earnings + Other Equity Equity Before Minority Interest + Minority/Non Controlling Interest Total Equity Total Liabilities & Equity 4.878.0 44,009.0 71.444.0 70.802.0 8420 6420 4821.0 53,303.0 83.625.0 63,918.0 19,7070 7810 18.926.0 21,351.0 0.0 25.0 22.480.0 0.0 12.0 0.0 7.677.0 7.2940 14.771.0 93,904.0 137.913.0 0.0 45.440.0 17.0 45.423.0 28.228.0 40.911.0 102.0 58.225.0 318.0 58.543.0 196.456.0 14,0320 104,976.0 158,279.0 0.0 45.9720 17.0 45.955.0 28.235.0 46.108.0 1.010.0 63,854.0 306.0 64.170.0 222.449.0 FY 2018 FY 2019 Short-Term Solvency, or Liquidity, Measures Current ratio: Quick ratio: Cash ratio: Long-Term Solvency Measures Total debt ratio: Debt-equity ratio: Equity multiplier: Times interest earned: Cash coverage: Asset Management, or Turnover, Measures Inventory turnover: Days' sales in inventory: Receivables turnover: Days' sales in receivables: Total asset turnover: Profitability Measures Profit margin: Return on assets (ROA): Return on equity (ROE): PM TAT * EM =ROE Dupont Identity Return on equity (ROE): LLLLL Commonsize FY 2019 FY 2018 $ FY 2018 194,579.00 S 185,735.00 $ 8.844.00 $ 163,041.00 S 163,041.00 $ 31,538.00 S S $ $ S S $ $ FY 2019 256,776.00 192,643.00 64,133.00 211,248.00 211,248.00 45,528.00 Revenue + Sales & Services Revenue + Other Revenue - Cost of Revenue + Cost of Goods & Services Gross Profit + Other Operating Income - Operating Expenses + Selling, General & Admin + Selling & Marketing + Research & Development + Other Operating Expense 20.747.00 $ 32.625.00 $ 364.00 $ 396.00 $ $ 20,383.00 32.229.00 anoon on 32 229.00 12.903.00 2.911.00 3.035.00 3.035.00 $ $ $ $ $ $ $ $ $ S $ + 20.383.00 $ 10.791.00 ls 2.815.00 $ 2.819.00 $ 2619.00 $ $ $ (4.00) 8.176.00 $ 0.770.00 $ 49200 S $ 43.00 6.149.00 88.00 (124.00 9,992.00 995.00 480.00 79.00 S $ $ 205.00 - $ 231.00 8.997.00 2.388.00 3.015.00 (649.00 6.631.00 + Other Operating Expense Operating Income (Loss) - Non-Operating (Income) Loss +Interest Expense, Net + Interest Expense - Interest Income +Foreign Exch (Gain) Loss + Other Non-Op (Income) Loss Pretax Income (Loss). Adjusted - Abnormal Losses (Gains) + Merger/Acquisition Expense + Early Extinguishment of Debt + Asset Write-Down + Impairment of Goodwill + Gain Loss on Sale Acquisition of Business Legal Settlement Restructuring + Other Abnormal Items Pretax Income (Loss), GAAP - Income Tax Expense (Benefit) Current Income Tax Deferred Income Tax Income (Loss) from Cont Ops - Net Extraordinary Losses (Gains) + Discontinued Operations + XO & Accounting Changes Income (Loss) Incl. MI - Minority interest Net Income, GAAP - Preferred Dividends Other Adjustments Net Income Avail to Common, GAAP Consolidated Balance Sheets - USD (S) Sin Millions Total Assets + Cash Cash Equivalents & STI + Cash & Cash Equivalents + ST Investments + Accounts & Notes Receiv + Accounts Receivable, Net + Notes Receivable, Net +Inventories +Raw Materials + Work In Process + Finished Goods + Other Inventory Other ST Assets + Derivative & Hedging Assets + Deferred Tax Assets + Misc ST Assets Total Current Assets + Property, Plant & Equip, Net $ $ $ $ $ $ S $ $ S $ $ S $ 1.406.00 $ 2.002.00 $ 1.979.00 $ 23 00 $ (596.00 $ $ $ $ (596.00 $ (2005 (594.00 $ $ $ (594.00) $ 6.631.00 (3.00 6.634.00 6.634.00 FY 2018 FY 2019 0.581.0 4,050.00 2.5220 17,631.0 17,631.01 0.01 16.450.00 8,058.0 5.883.0 2.373.0 19,617.0 19,617.0 0.0 17,516,0 4.581.00 5.113.0 4.581.0 45.243.0 11,340.0 5.113.0 50,302.0 32.904.0 124 1320 115.2020 78,67801 36,524.0 121,9290 112.8700 79 749.0 33, 121.0 8,930.0 151,213.0 196.456.0 9,0590 172.147.0 222.449.0 37.148.00 14. 135.0 43,1050 17,3710 23.013.0 1.985.0 720.0 25.734.0 5,377.0 0.0 1,623.0 27.0 1,5960 3.7540 4.821.0 0.0 1.285.0 48780 0.0 + Other LT Assets + Total Intangible Assets + Goodwill + Other Intangible Assets + Deferred Tax Assets Derivative & Hedging Assets + Misc LT Assets Total Noncurrent Assets Total Assets Liabilities & Shareholders' Equity +Payables & Accruals + Accounts Payable + Accrued Taxes + Interest & Dividends Payable + Other Payables & Accruals + ST Debt +ST Borrowings +ST Lease Liabilities + ST Finance Leases + ST Operating Leases + Current Portion of LT Debt + Other ST Liabilities + Deferred Revenue + Derivatives & Hedging + Misc ST Liabilities Total Current Liabilities +LT Debt +LT Borrowings +LT Lease Liabilities +LT Finance Leases +LT Operating Leases + Other LT Liabilities + Accrued Liabilities Pension Liabilities Deferred Revenue Deferred Tax Liabilities + Derivatives & Hedging Misc LT Liabilities Total Noncurrent Liabilities Total Liabilities + Preferred Equity and Hybrid Capital + Share Capital & APIC + Common Stock + Additional Paid in Capital - Treasury Stock +Retained Earnings + Other Equity Equity Before Minority Interest + Minority/Non Controlling Interest Total Equity Total Liabilities & Equity 4.878.0 44,009.0 71.444.0 70.802.0 8420 6420 4821.0 53,303.0 83.625.0 63,918.0 19,7070 7810 18.926.0 21,351.0 0.0 25.0 22.480.0 0.0 12.0 0.0 7.677.0 7.2940 14.771.0 93,904.0 137.913.0 0.0 45.440.0 17.0 45.423.0 28.228.0 40.911.0 102.0 58.225.0 318.0 58.543.0 196.456.0 14,0320 104,976.0 158,279.0 0.0 45.9720 17.0 45.955.0 28.235.0 46.108.0 1.010.0 63,854.0 306.0 64.170.0 222.449.0
Step by Step Solution
There are 3 Steps involved in it

Get step-by-step solutions from verified subject matter experts