

Question: just need (c) and (e) result followyt (a) bevelop a scatter thagram for these dats with the speed of enecueion as the independent variable. (b)
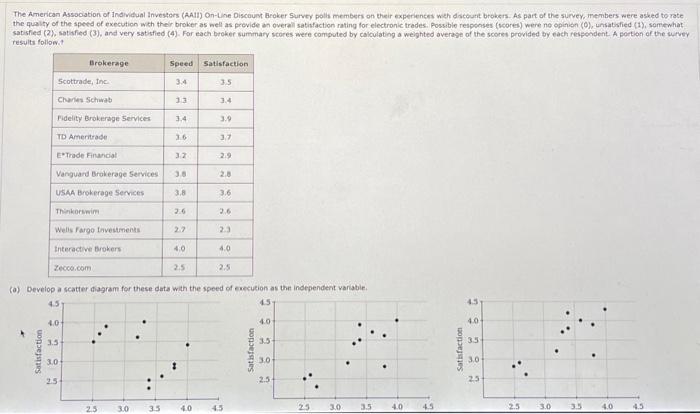
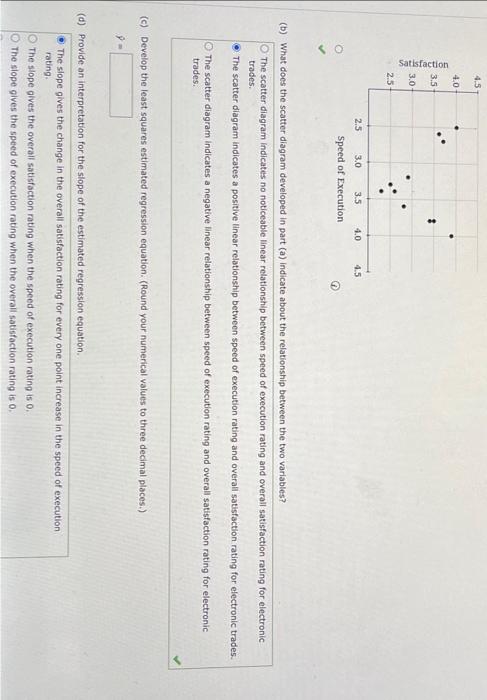
result followyt (a) bevelop a scatter thagram for these dats with the speed of enecueion as the independent variable. (b) What does the scatter diagram developed in part (a) indicate about the relationship between the two variables? The scatter diagram indicates no noticeable linear relationship between speed of execution rating and overall satisfaction rating for electronic trades. The scatter diagram indicates a positive linear relationship between speed of execution rating and overall satisfaction rating for electronic trades. The scatter diagram indicates a negative linear relationship between speed of execution rating and overall satisfaction rating for electronic trades. (c) Develop the least squares estimated regression equation. (Round your numerical values to three decimal places.) y= (d) Provide an interpretation for the slope of the estimated regression equation. The slope gives the change in the overall satisfaction rating for every one point increase in the speed of execution rating. The slope gives the overall satisfaction rating when the speed of execution rating is 0 . The slope gives the speed of execution rating when the overall satisfaction rating is 0 . e) Suppose Thinkorswim developed new software to increase their speed of executlon rating. If the new software is able to increase their speed of execution rating from the current value of 2.6 to the average speed of execution rating for the other 10 brokeroge firms that were surveyed, what value would you predict for the everall satisfaction rading? (Round your answer to one decimal place.)
Step by Step Solution
There are 3 Steps involved in it

Get step-by-step solutions from verified subject matter experts