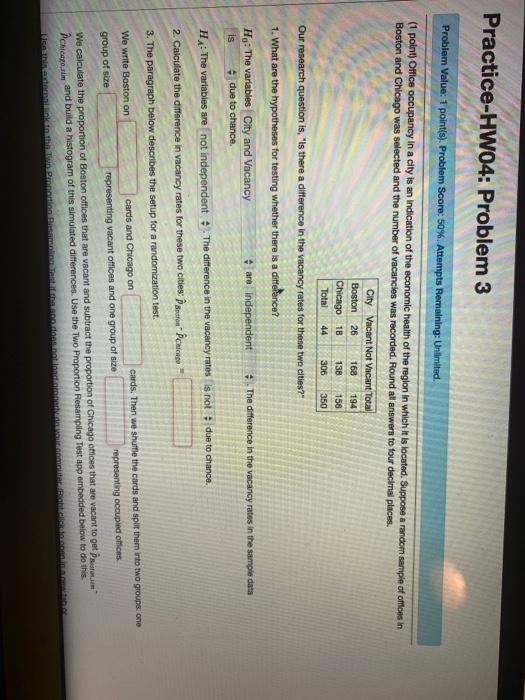
Question: JUST NEED HELP WITH RED BLANKS (1 point) Office occupancy In a city is an indication of the economic health of the region in which

JUST NEED HELP WITH RED BLANKS JUST NEED HELP WITH RED BLANKS (1 point) Office
JUST NEED HELP WITH RED BLANKS (1 point) Office
(1 point) Office occupancy In a city is an indication of the economic health of the region in which it is located. Suppose a random sample of offices in Boston and Chicago was selected and the number of vacancies was recorded. Round all answers to four decimal places City Vacant Not Vicent Total Boston 26 108 194 Chicago 18 138 156 Total 44 306 350 Our research question is, is there a difference in the vacancy rates for these two cities?" 1. What are the hypotheses for testing whether there is a difference? Ho: The variables City and Vacancy are independent The difference in the vacancy rates in the sample data is due to chance H,: The variables are not independent. The difference in the vacancy rate is not due to chance 2. Calculate the difference in vacancy rates for these two cities: Prome Poncare 3. The paragraph below describes the setup for a randomization test We write Boston on cards and Chicago on cards. Then we shuffle the cards and split them into two groups on representing occupied offices representing vacant offices and one group of size group of size We calculate the proportion of Boston offices that are vacant and subtract the proportion of Chicago offices that are Vacant to get PChicap,in and build a histogram of this simulated differences. Use the Two Proportion Resampling Test app embedded below to do this Use this external link to the Two Proportion Resampling Test if the app does not load properly on your computer. (Right click to open in a new tab or window.) TWUTTopondom nesamping Test Test Information Enter your data into the table below, or choose one of the data presets. Press the Shuttle 1 Grados Row 1 0 Show observed difference Row 2 0 Count Samples greater than Total 0 Reset Shuffle how many times? 100 Enter a value from 1 to 5000 Shuffle 4. Choosing the "beyond' option for the counted samples and shuffling at least 3000 times, what is the approximate p-value for the hypothesis teat? D-value 5. Cheryl takes a different sample and conducts the hypothesis test. She gets a p-value of 0.1448. How much widence does Chery have that the ne model is not a good fit for her observed result? O A Little B. Some C. Strong D. Very Strong E. Extremely Strong that the null model is not a good fit for our observed data. Help Entering Answers Preview My Answers Submit Answers Results for this submission Answer Pow Entered Practice-HW04: Problem 3 Problem Value: 1 pointis). Problem Score: 50%. Attempts Remaining: Unlimited 138 158 350 44 (1 point) Office occupancy in a city is an Indication of the economic health of the region in which it is located. Suppose a random sample of offices in Boston and Chicago was selected and the number of vacancies was recorded. Round all answers to tour decimal places. City Vacant Not Vacant Total Boston 26 168 194 Chicago 18 Total 306 Our research question is, "Is there a difference in the vacancy rates for these two citles?" 1. What are the hypotheses for testing whether there is a diffeance? H: The variables City and Vacancy are independent *. The difference in the vacancy rates in the sample data due to chance H: The variables are not independent 4 - The difference in the vacancy rates is not due to chance. 2. Calculate the difference in vacancy rates for these two citles: Boston BChicago 3. The paragraph below describes the setup for a randomization test. cards. Then we shuffle the cards and split them into two groups one cards and Chicago on We write Boston on representing vacant offices and one group of size representing occupied offices is group of size We calculate the proportion of Boston offices that are vacant and subtract the proportion of Chicago offices that are vacant to get PChicago, and build a histogram of this simulated differences. Use the Two Proportion Resampling Test app embedded below to do this Usthadh ann an does notion.com SISU Grades Preview My Answers Submit Answers Results for this submission Entero Answer Preview Result City and Vacancy City and Vacancy DOITOCE Independent independent Domet Is is DO not Independent not independent Comet is not is not correct incornict incorrect incorect incorrect Incorrect incorrect A CORTECE At least one of the answers above is NOT correct 6 of the questions remain unanswered Page generated at 10/15/2020 al 07 pm EST Wikip PATI WOW (1 point) Office occupancy In a city is an indication of the economic health of the region in which it is located. Suppose a random sample of offices in Boston and Chicago was selected and the number of vacancies was recorded. Round all answers to four decimal places City Vacant Not Vicent Total Boston 26 108 194 Chicago 18 138 156 Total 44 306 350 Our research question is, is there a difference in the vacancy rates for these two cities?" 1. What are the hypotheses for testing whether there is a difference? Ho: The variables City and Vacancy are independent The difference in the vacancy rates in the sample data is due to chance H,: The variables are not independent. The difference in the vacancy rate is not due to chance 2. Calculate the difference in vacancy rates for these two cities: Prome Poncare 3. The paragraph below describes the setup for a randomization test We write Boston on cards and Chicago on cards. Then we shuffle the cards and split them into two groups on representing occupied offices representing vacant offices and one group of size group of size We calculate the proportion of Boston offices that are vacant and subtract the proportion of Chicago offices that are Vacant to get PChicap,in and build a histogram of this simulated differences. Use the Two Proportion Resampling Test app embedded below to do this Use this external link to the Two Proportion Resampling Test if the app does not load properly on your computer. (Right click to open in a new tab or window.) TWUTTopondom nesamping Test Test Information Enter your data into the table below, or choose one of the data presets. Press the Shuttle 1 Grados Row 1 0 Show observed difference Row 2 0 Count Samples greater than Total 0 Reset Shuffle how many times? 100 Enter a value from 1 to 5000 Shuffle 4. Choosing the "beyond' option for the counted samples and shuffling at least 3000 times, what is the approximate p-value for the hypothesis teat? D-value 5. Cheryl takes a different sample and conducts the hypothesis test. She gets a p-value of 0.1448. How much widence does Chery have that the ne model is not a good fit for her observed result? O A Little B. Some C. Strong D. Very Strong E. Extremely Strong that the null model is not a good fit for our observed data. Help Entering Answers Preview My Answers Submit Answers Results for this submission Answer Pow Entered Practice-HW04: Problem 3 Problem Value: 1 pointis). Problem Score: 50%. Attempts Remaining: Unlimited 138 158 350 44 (1 point) Office occupancy in a city is an Indication of the economic health of the region in which it is located. Suppose a random sample of offices in Boston and Chicago was selected and the number of vacancies was recorded. Round all answers to tour decimal places. City Vacant Not Vacant Total Boston 26 168 194 Chicago 18 Total 306 Our research question is, "Is there a difference in the vacancy rates for these two citles?" 1. What are the hypotheses for testing whether there is a diffeance? H: The variables City and Vacancy are independent *. The difference in the vacancy rates in the sample data due to chance H: The variables are not independent 4 - The difference in the vacancy rates is not due to chance. 2. Calculate the difference in vacancy rates for these two citles: Boston BChicago 3. The paragraph below describes the setup for a randomization test. cards. Then we shuffle the cards and split them into two groups one cards and Chicago on We write Boston on representing vacant offices and one group of size representing occupied offices is group of size We calculate the proportion of Boston offices that are vacant and subtract the proportion of Chicago offices that are vacant to get PChicago, and build a histogram of this simulated differences. Use the Two Proportion Resampling Test app embedded below to do this Usthadh ann an does notion.com SISU Grades Preview My Answers Submit Answers Results for this submission Entero Answer Preview Result City and Vacancy City and Vacancy DOITOCE Independent independent Domet Is is DO not Independent not independent Comet is not is not correct incornict incorrect incorect incorrect Incorrect incorrect A CORTECE At least one of the answers above is NOT correct 6 of the questions remain unanswered Page generated at 10/15/2020 al 07 pm EST Wikip PATI WOW

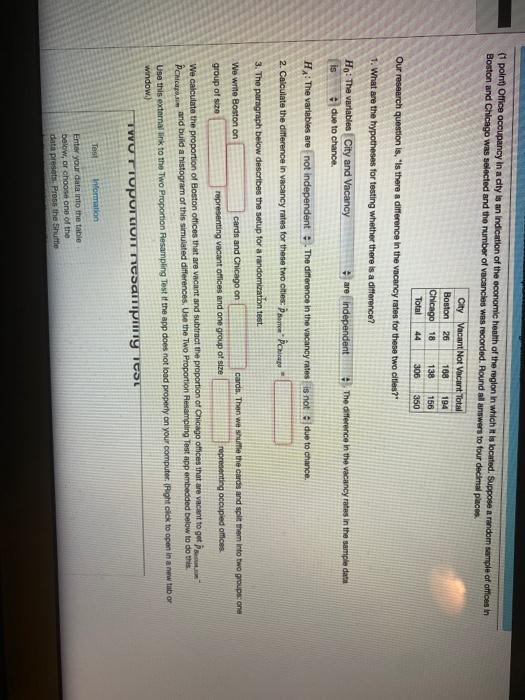
Step by Step Solution

There are 3 Steps involved in it

1 Expert Approved Answer
Step: 1 Unlock blur-text-image
Question Has Been Solved by an Expert!

Get step-by-step solutions from verified subject matter experts

Step: 2 Unlock
Step: 3 Unlock

Students Have Also Explored These Related General Management Questions!