

Question: Just need the last section done. The: Analysis Component Refer the following table. Tia's Trampolines Inc. Comparative Balance Sheet Information November 30 (millions of $)
 Just need the last section done. The: Analysis Component
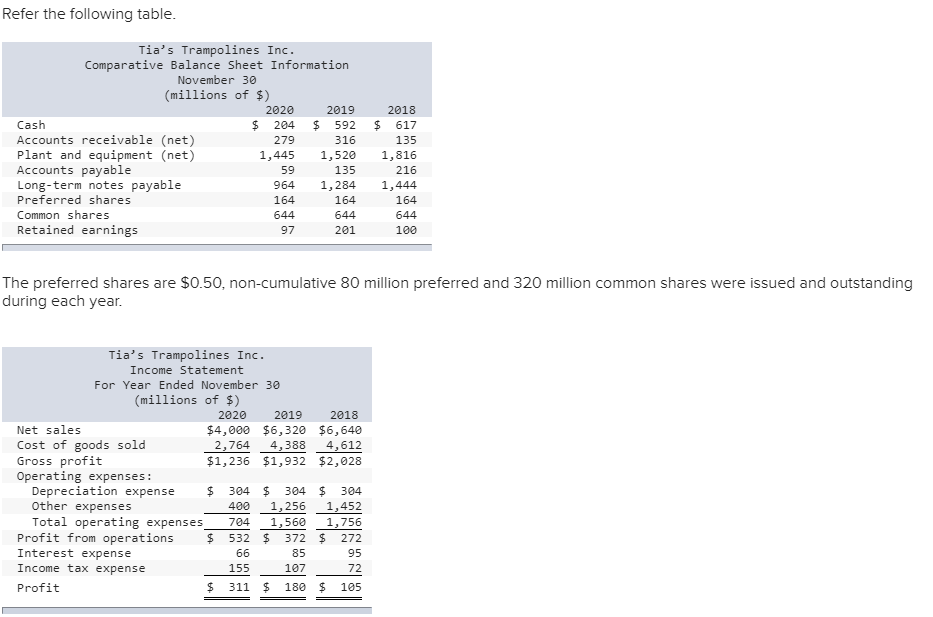
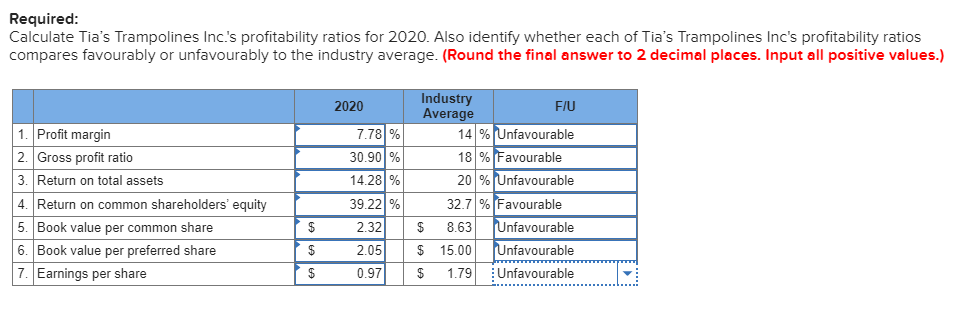
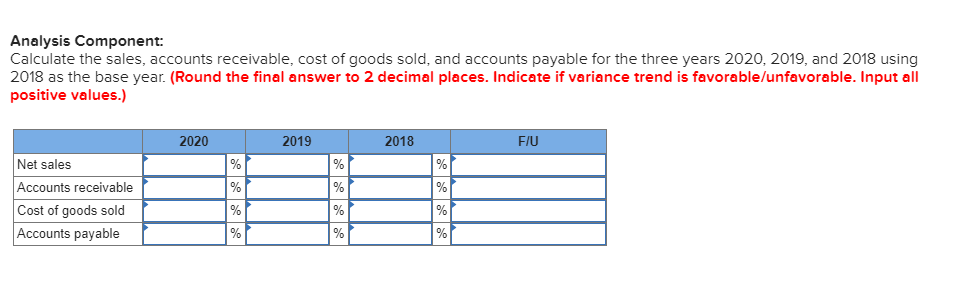
Refer the following table. Tia's Trampolines Inc. Comparative Balance Sheet Information November 30 (millions of $) 2020 2019 Cash $ 204 $ 592 Accounts receivable (net) 279 316 Plant and equipment (net) 1,445 1,520 Accounts payable 59 135 Long-term notes payable 964 1,284 Preferred shares 164 164 Common shares 644 644 Retained earnings 97 201 2018 $ 617 135 1,816 216 1,444 164 644 100 The preferred shares are $0.50, non-cumulative 80 million preferred and 320 million common shares were issued and outstanding during each year. Tia's Trampolines Inc. Income Statement For Year Ended November 30 (millions of $) 2020 2019 2018 Net sales $4,000 $6,320 $6,640 Cost of goods sold 2,764 4,388 4,612 Gross profit $1,236 $1,932 $2,028 Operating expenses: Depreciation expense $ 304 $ 304 $ 304 Other expenses 400 1,256 1,452 Total operating expenses 704 1,560 1,756 Profit from operations 532 $ 372 $ 272 Interest expense 66 85 95 Income tax expense 155 107 72 Profit $ 311 $ 180 $ 105 $ Required: Calculate Tia's Trampolines Inc.'s profitability ratios for 2020. Also identify whether each of Tia's Trampolines Inc's profitability ratios compares favourably or unfavourably to the industry average. (Round the final answer to 2 decimal places. Input all positive values.) 2020 7.78% 30.90% 14.28% 1. Profit margin 2. Gross profit ratio 3. Return on total assets 4. Return on common shareholders' equity 5. Book value per common share 6. Book value per preferred share 7. Earnings per share Industry F/U Average 14 % Unfavourable 18% Favourable 20 % Unfavourable 32.7 % Favourable $ 8.63 Unfavourable $ 15.00 Unfavourable $ 1.79 Unfavourable $ 39.22% 2.32 2.05 0.97 $ AGAEA $ Refer the following table. Tia's Trampolines Inc. Comparative Balance Sheet Information November 30 (millions of $) 2020 2019 Cash $ 204 $ 592 Accounts receivable (net) 279 316 Plant and equipment (net) 1,445 1,520 Accounts payable 59 135 Long-term notes payable 964 1,284 Preferred shares 164 164 Common shares 644 644 Retained earnings 97 201 2018 $ 617 135 1,816 216 1,444 164 644 100 The preferred shares are $0.50, non-cumulative 80 million preferred and 320 million common shares were issued and outstanding during each year. Tia's Trampolines Inc. Income Statement For Year Ended November 30 (millions of $) 2020 2019 2018 Net sales $4,000 $6,320 $6,640 Cost of goods sold 2,764 4,388 4,612 Gross profit $1,236 $1,932 $2,028 Operating expenses: Depreciation expense $ 304 $ 304 $ 304 Other expenses 400 1,256 1,452 Total operating expenses 704 1,560 1,756 Profit from operations 532 $ 372 $ 272 Interest expense 66 85 95 Income tax expense 155 107 72 Profit $ 311 $ 180 $ 105 $ Required: Calculate Tia's Trampolines Inc.'s profitability ratios for 2020. Also identify whether each of Tia's Trampolines Inc's profitability ratios compares favourably or unfavourably to the industry average. (Round the final answer to 2 decimal places. Input all positive values.) 2020 7.78% 30.90% 14.28% 1. Profit margin 2. Gross profit ratio 3. Return on total assets 4. Return on common shareholders' equity 5. Book value per common share 6. Book value per preferred share 7. Earnings per share Industry F/U Average 14 % Unfavourable 18% Favourable 20 % Unfavourable 32.7 % Favourable $ 8.63 Unfavourable $ 15.00 Unfavourable $ 1.79 Unfavourable $ 39.22% 2.32 2.05 0.97 $ AGAEA $
Step by Step Solution
There are 3 Steps involved in it

Get step-by-step solutions from verified subject matter experts