

Question: Just need the scatter plot and Y= ______ + (______) Find the equation of the regression line for the given data. Then construct a scatter
Just need the scatter plot and Y= ______ + (______)
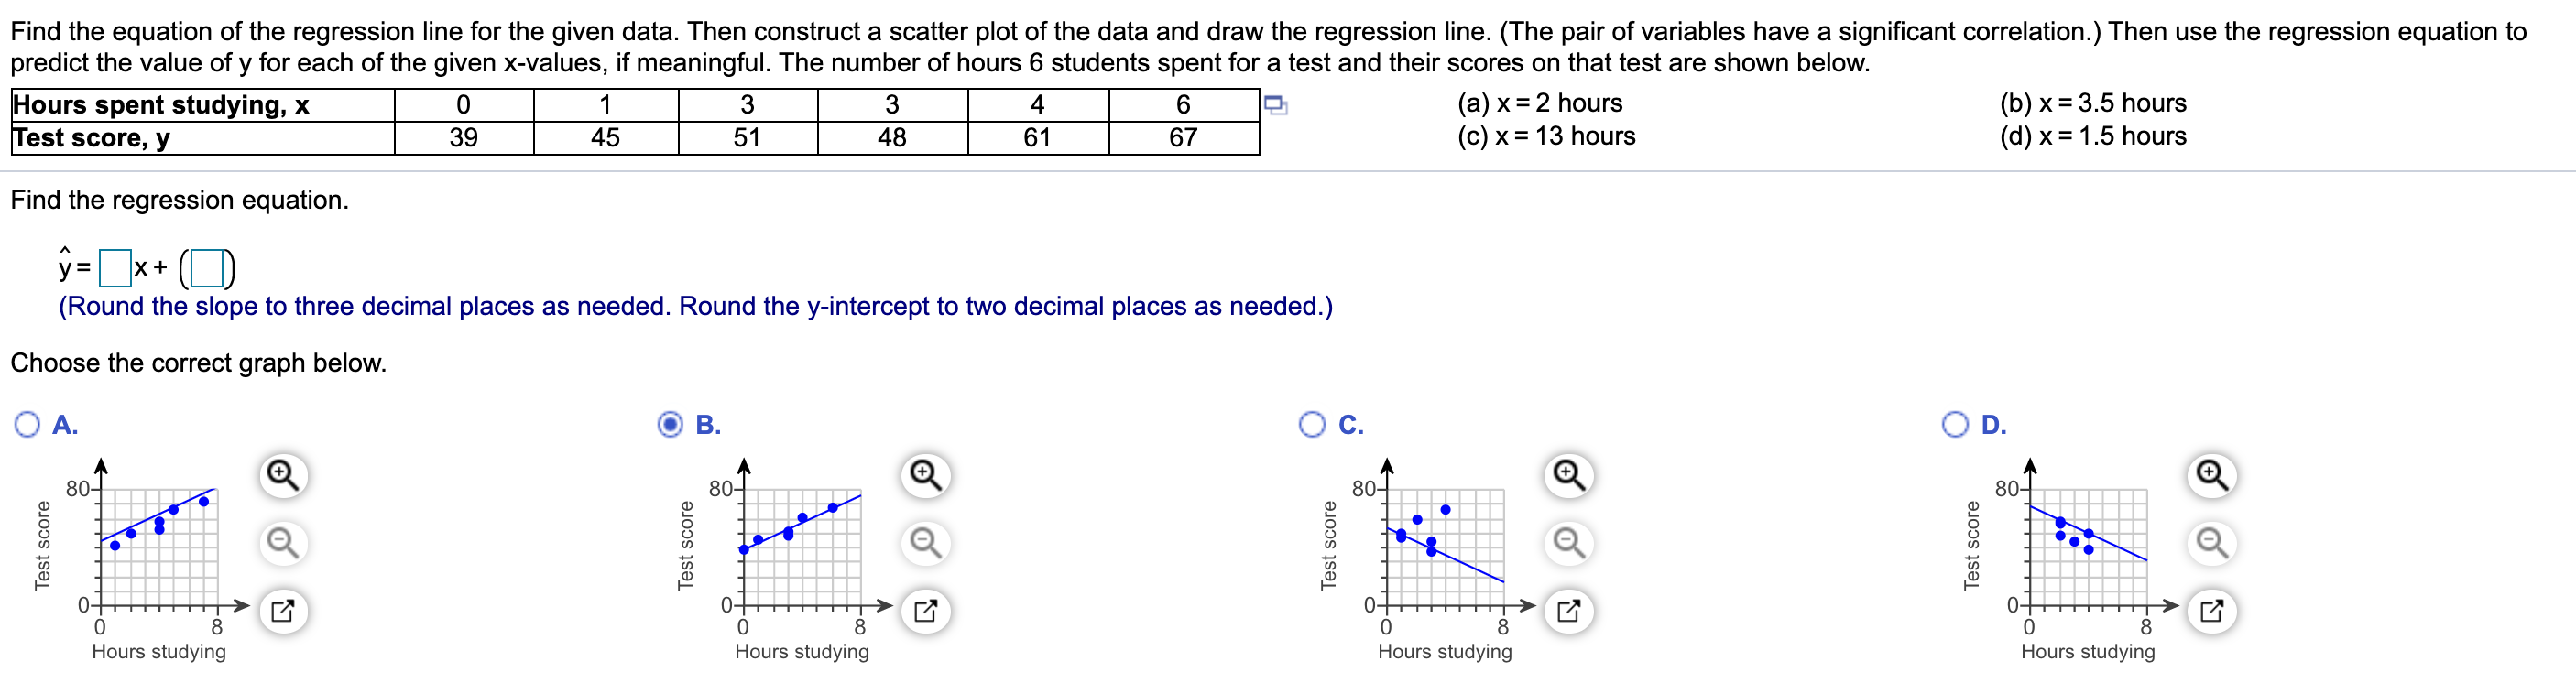
Find the equation of the regression line for the given data. Then construct a scatter plot of the data and draw the regression line. (The pair of variables have a signicant correlation.) Then use the regression equation to predict the value of y for each of the given x-values, if meaningful. The number of hours 6 students spent for a test and their scores on that test are shown below. Hours spent studying, x 0 1 3 3 4 6 q: (a) x = 2 hours (b) X = 3.5 hours Test score, y 39 45 51 48 61 67 (c) x= 13 hours (d) x = 1.5 hours Find the regression equation. it: x + ( (Round the slope to three decimal places as needed. Round the yintercept to two decimal places as needed.) Choose the correct graph below. OA. B. Oc. OD. Test score Test score Test score Tesl score 0 0 Hours studying Hours studying Hours studying Hours studying
Step by Step Solution
There are 3 Steps involved in it

Get step-by-step solutions from verified subject matter experts