

Question: Just question 2 needs to be answered please Price Quantity Cabbage (1b) Price $0.06 Quantity 2000 $0.05 Carrots (bunch) 1500 $0. 10 200 $0. 12
Just question 2 needs to be answered please

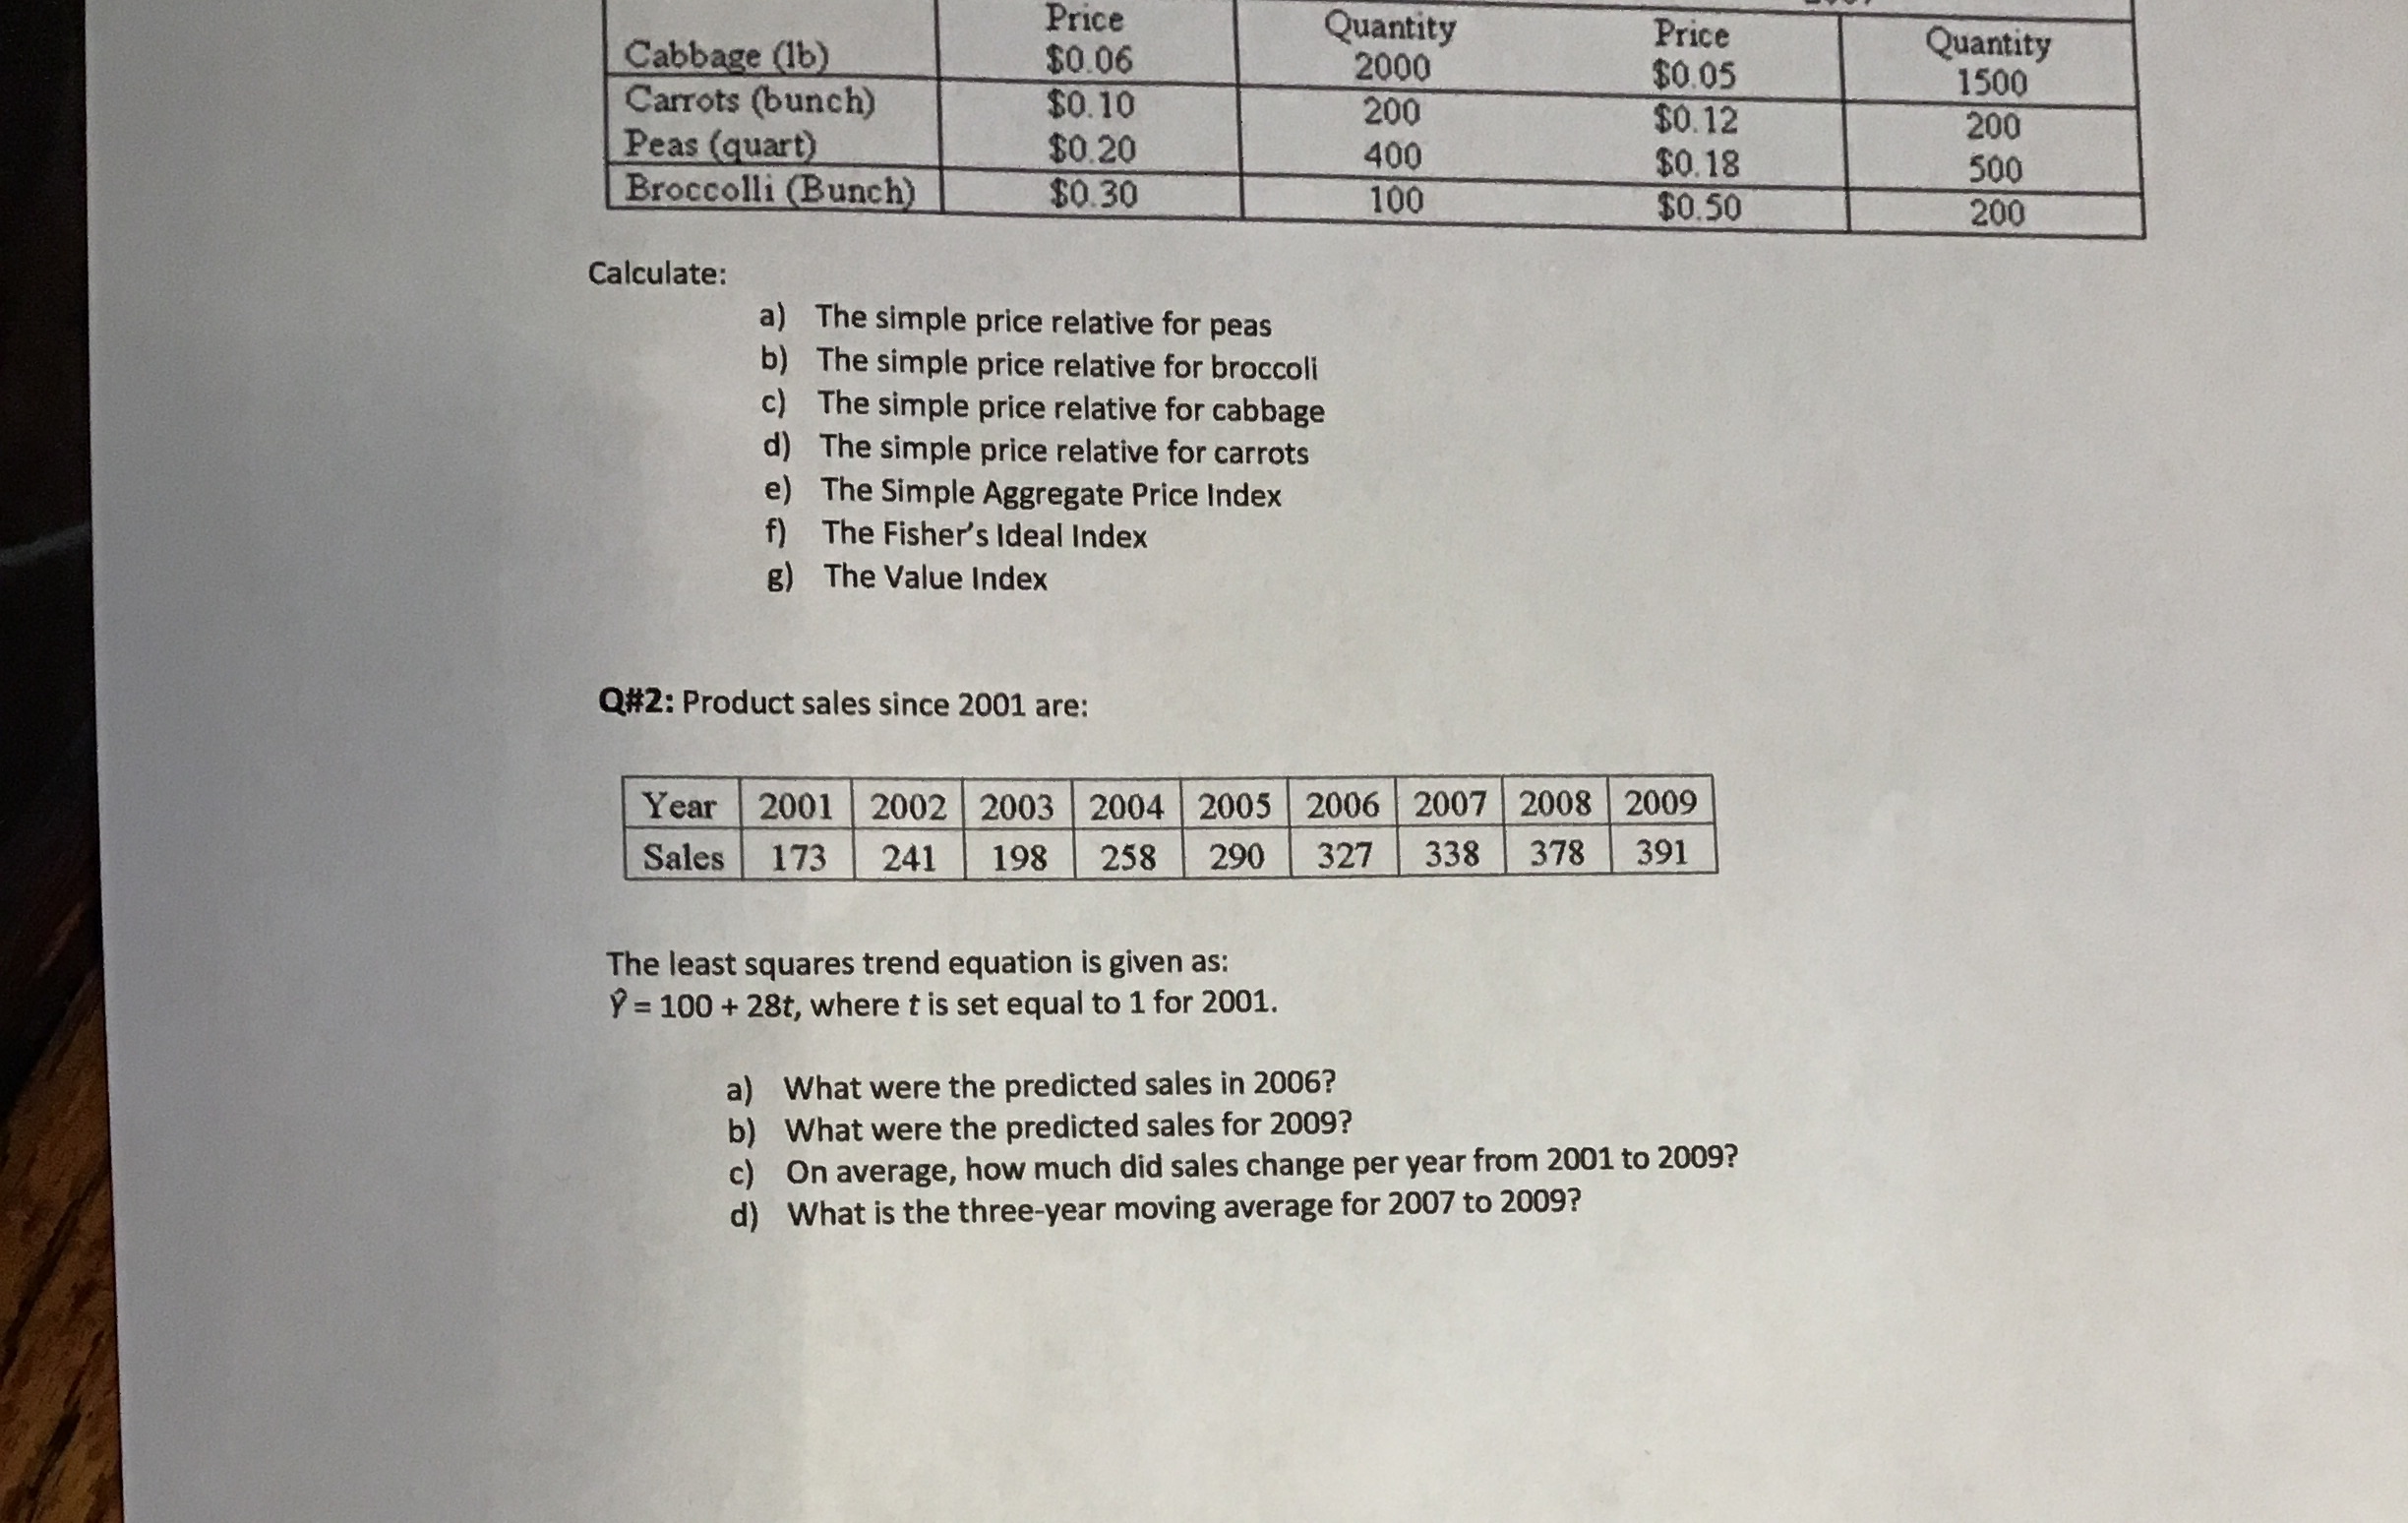
Price Quantity Cabbage (1b) Price $0.06 Quantity 2000 $0.05 Carrots (bunch) 1500 $0. 10 200 $0. 12 200 Peas (quart) $0.20 400 $0. 18 500 Broccolli (Bunch) $0.30 100 $0.50 200 Calculate: a) The simple price relative for peas b) The simple price relative for broccoli c) The simple price relative for cabbage d) The simple price relative for carrots e) The Simple Aggregate Price Index f) The Fisher's Ideal Index g) The Value Index Q#2: Product sales since 2001 are: Year 2001 2002 2003 2004 2005 2006 2007 2008 2009 Sales 173 241 198 258 290 327 338 378 391 The least squares trend equation is given as: Y = 100 + 28t, where t is set equal to 1 for 2001. a) What were the predicted sales in 2006? b) What were the predicted sales for 2009? c) On average, how much did sales change per year from 2001 to 2009? d) What is the three-year moving average for 2007 to 2009
Step by Step Solution
There are 3 Steps involved in it

Get step-by-step solutions from verified subject matter experts