

Question: K The data given to the right includes data from 42 candies, and 10 of them are red. Weights (g) of a Sample Bag
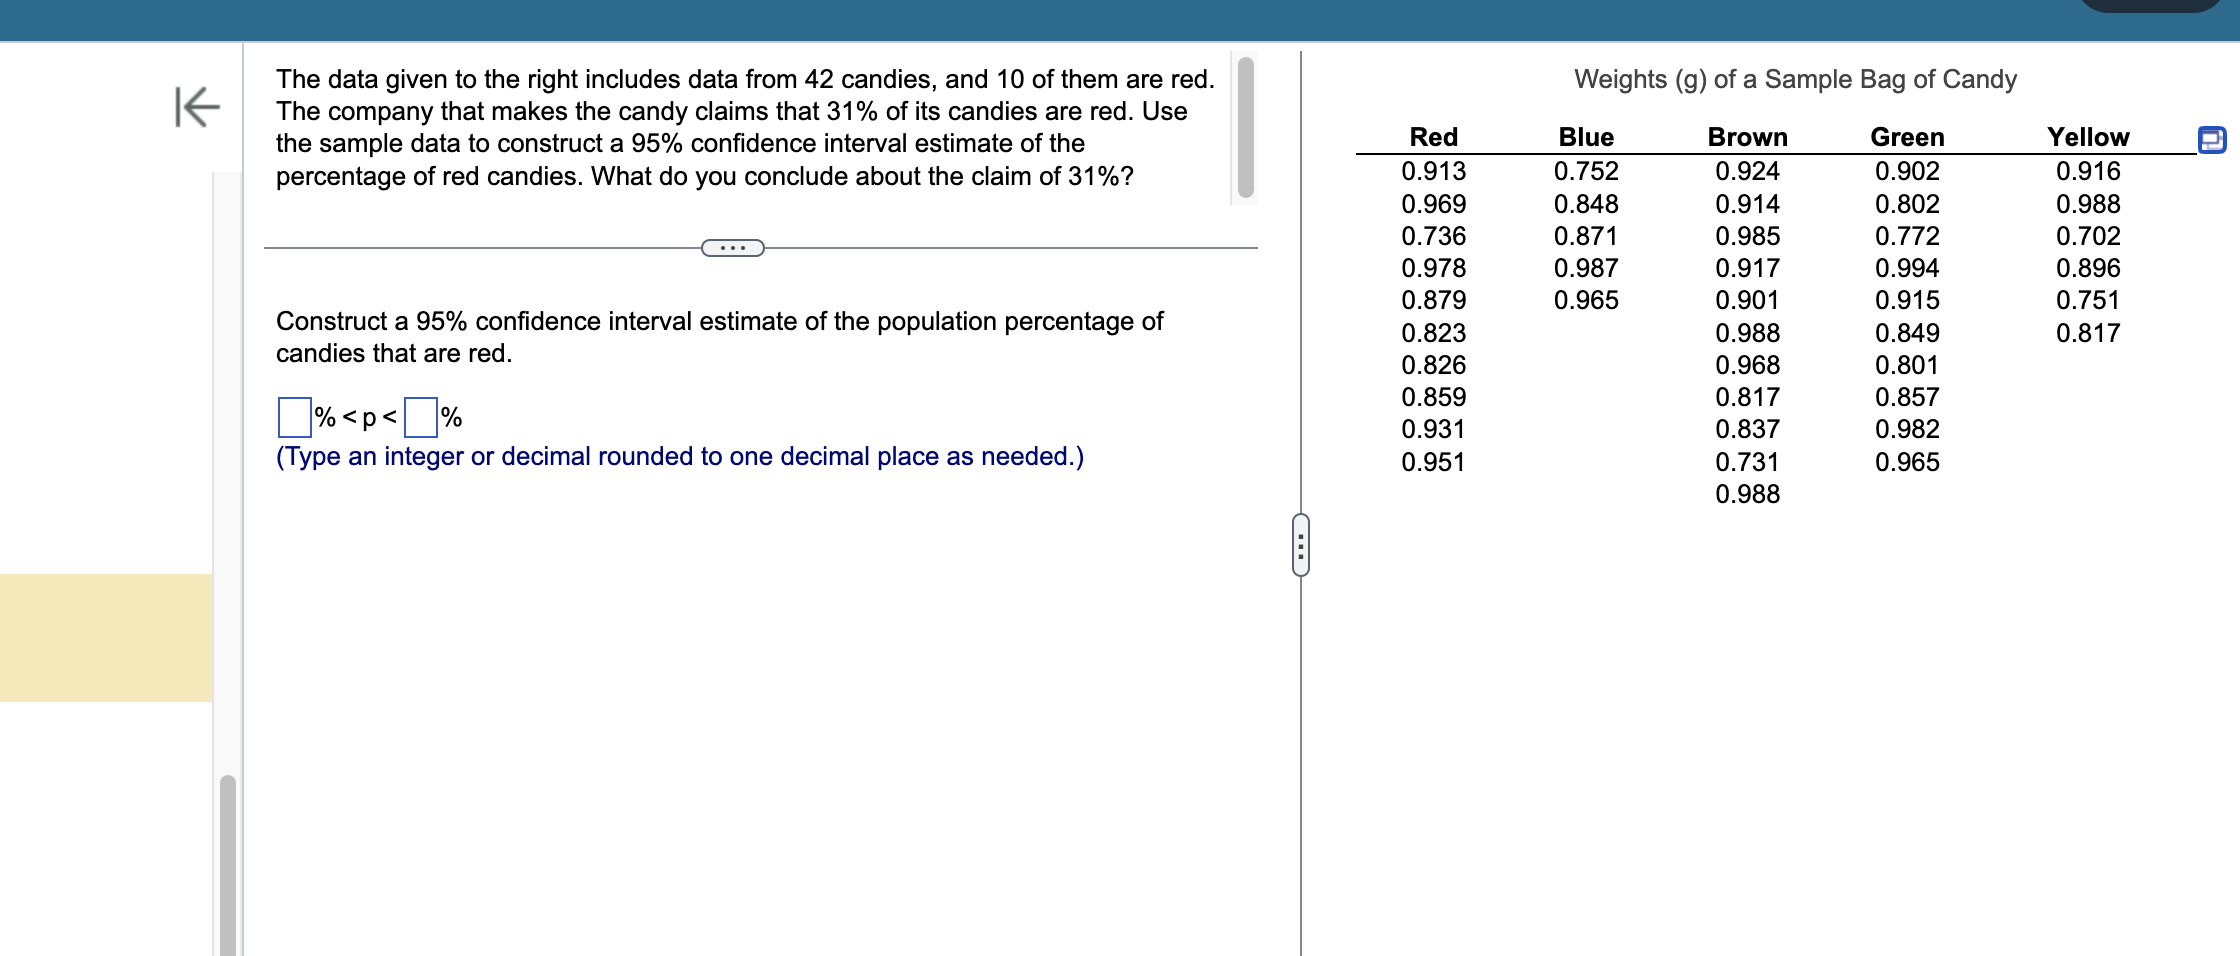
K The data given to the right includes data from 42 candies, and 10 of them are red. Weights (g) of a Sample Bag of Candy The company that makes the candy claims that 31% of its candies are red. Use the sample data to construct a 95% confidence interval estimate of the percentage of red candies. What do you conclude about the claim of 31%? Red Blue Brown Green Yellow 0.913 0.752 0.924 0.902 0.916 0.969 0.848 0.914 0.802 0.988 0.736 0.871 0.985 0.772 0.702 0.978 0.987 0.917 0.994 0.896 0.879 0.965 0.901 0.915 0.751 Construct a 95% confidence interval estimate of the population percentage of candies that are red. 0.823 0.988 0.849 0.817 0.826 0.968 0.801 0.859 0.817 0.857 %
Step by Step Solution
There are 3 Steps involved in it

Get step-by-step solutions from verified subject matter experts