

Question: K Use a calculator or computer software to generate a normal quantile plot for the data in the accompanying table. Then determine whether the
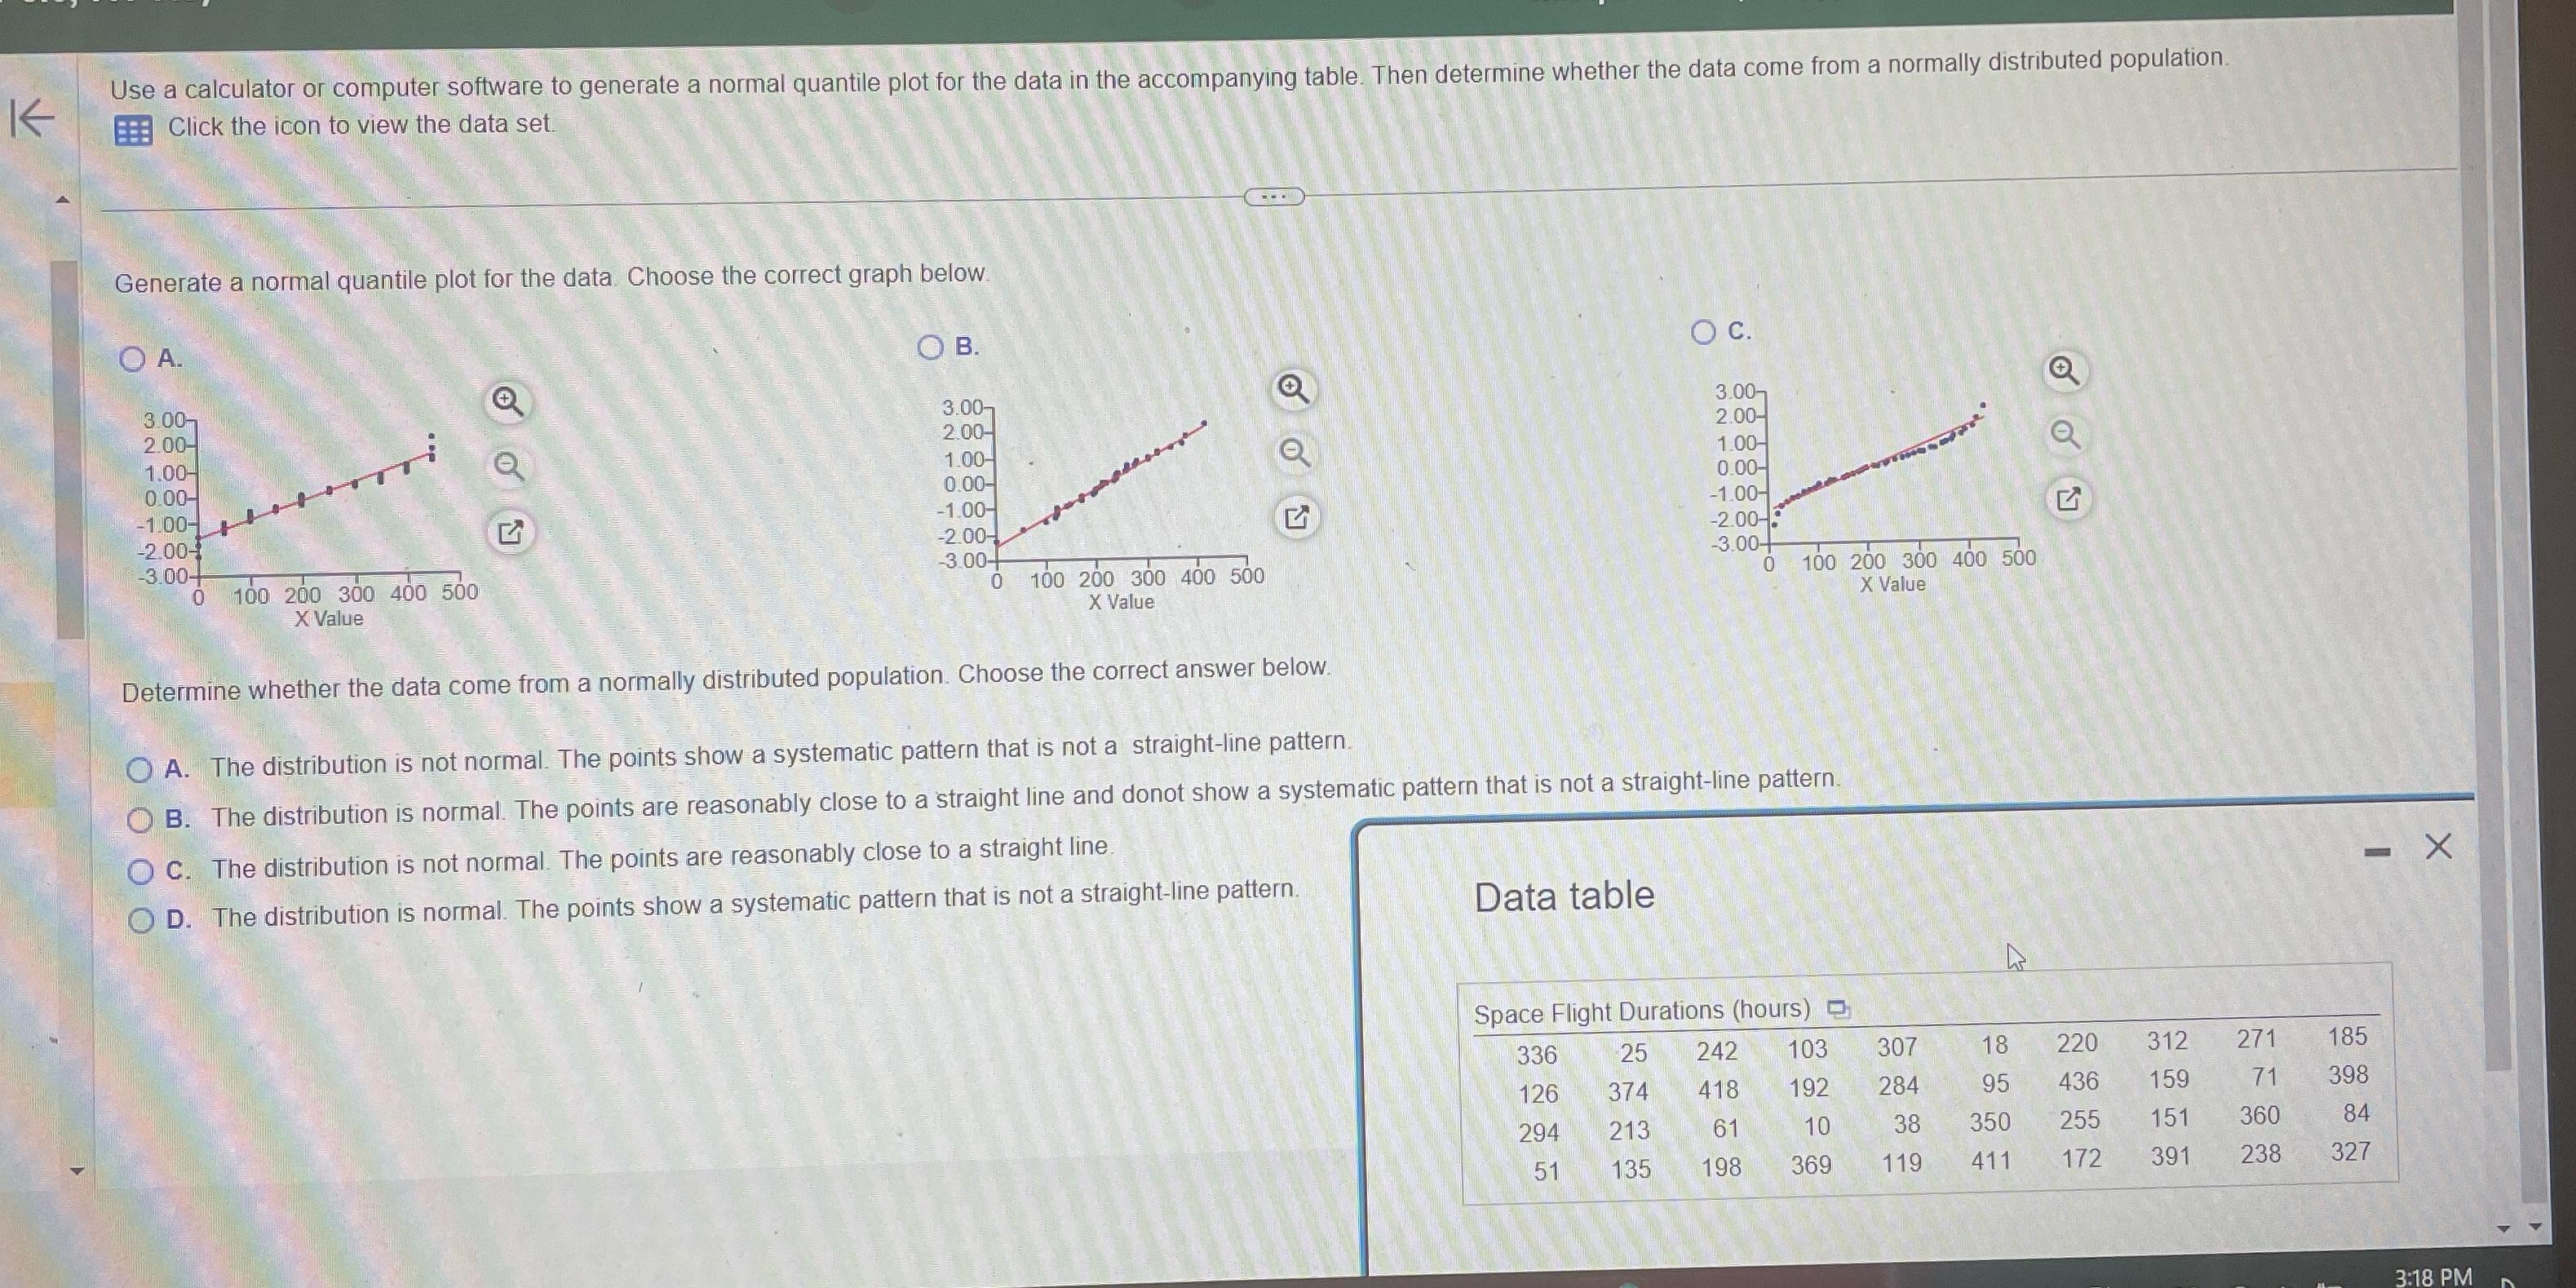
K Use a calculator or computer software to generate a normal quantile plot for the data in the accompanying table. Then determine whether the data come from a normally distributed population. Click the icon to view the data set. Generate a normal quantile plot for the data. Choose the correct graph below. O A. 3.00- 2.00- 1.00- 0.00- -1.00- G -2.00 -3.00- 0 100 200 300 400 500 X Value O B. C. 3.00- 3.00- 2.00- 2.00- 1.00- 1.00- 0.00- 0.00- -1.00- -1.00- G -2.00- -2.00- -3.00- 0 -3.00- 100 200 300 400 500 X Value 0 100 200 300 400 500 X Value Determine whether the data come from a normally distributed population. Choose the correct answer below. OA. The distribution is not normal. The points show a systematic pattern that is not a straight-line pattern. OB. The distribution is normal. The points are reasonably close to a straight line and donot show a systematic pattern that is not a straight-line pattern. OC. The distribution is not normal. The points are reasonably close to a straight line. OD. The distribution is normal. The points show a systematic pattern that is not a straight-line pattern. Data table 43 G L Space Flight Durations (hours) 336 25 242 103 307 18 220 312 271 185 126 374 418 192 284 95 436 159 71 398 294 213 61 10 38 350 255 151 360 84 51 135 198 369 119 411 172 391 238 327 X 3:18 PM
Step by Step Solution
There are 3 Steps involved in it

Get step-by-step solutions from verified subject matter experts